
August 2023
1. Dashboard Updates
Added more functionality to the Dashboard! Now all risk metrics have been applied to the following asset groups:
Risk by Transmission Circuit
Risk by Distribution Circuit
Risk by Power Facility
From the dashboard, click the map pin icon to zoom to that location on the map or click the eyeball icon to view that locations forecast details.
Dashboard Features Expanded
2. Asset List Updates → Now Called “Map Layer Data”
The Asset List has been updated to show the details for any layer turned on in the Map Reference Layers. The data that appears in the list now becomes more of a Map Layer Data panel. If you still want the map layers on, but do not need to show the layer data in the Map Layer Data, click the “x” in the chip, next to the title name at the top of the Map Layer Data panel. You can also use the data table icon from the list of Map Reference Layers to turn “on” or “off” these layer details.

Data Layer icon
Assets List is now a Map Data Layer panel for the Map Reference Layers
Pro Tip: Quickly enable a layer and the associated data panel by clicking on the data table icon. Or double click a data table icon to quickly switch data table views to the layer of interest.
3. Updates to Weather Station Layer
The weather stations icons have been updated to portray wind gust and wind speed observations. Rather than colored by a temperature scale, the wind icons are now colored in relation to wind gust information. The icons are still scaled by wind speed data and point in the direction the wind is flowing. For weather stations that do not have wind speed or wind direction data, the icons for these stations appear as black dots and not wind arrows.
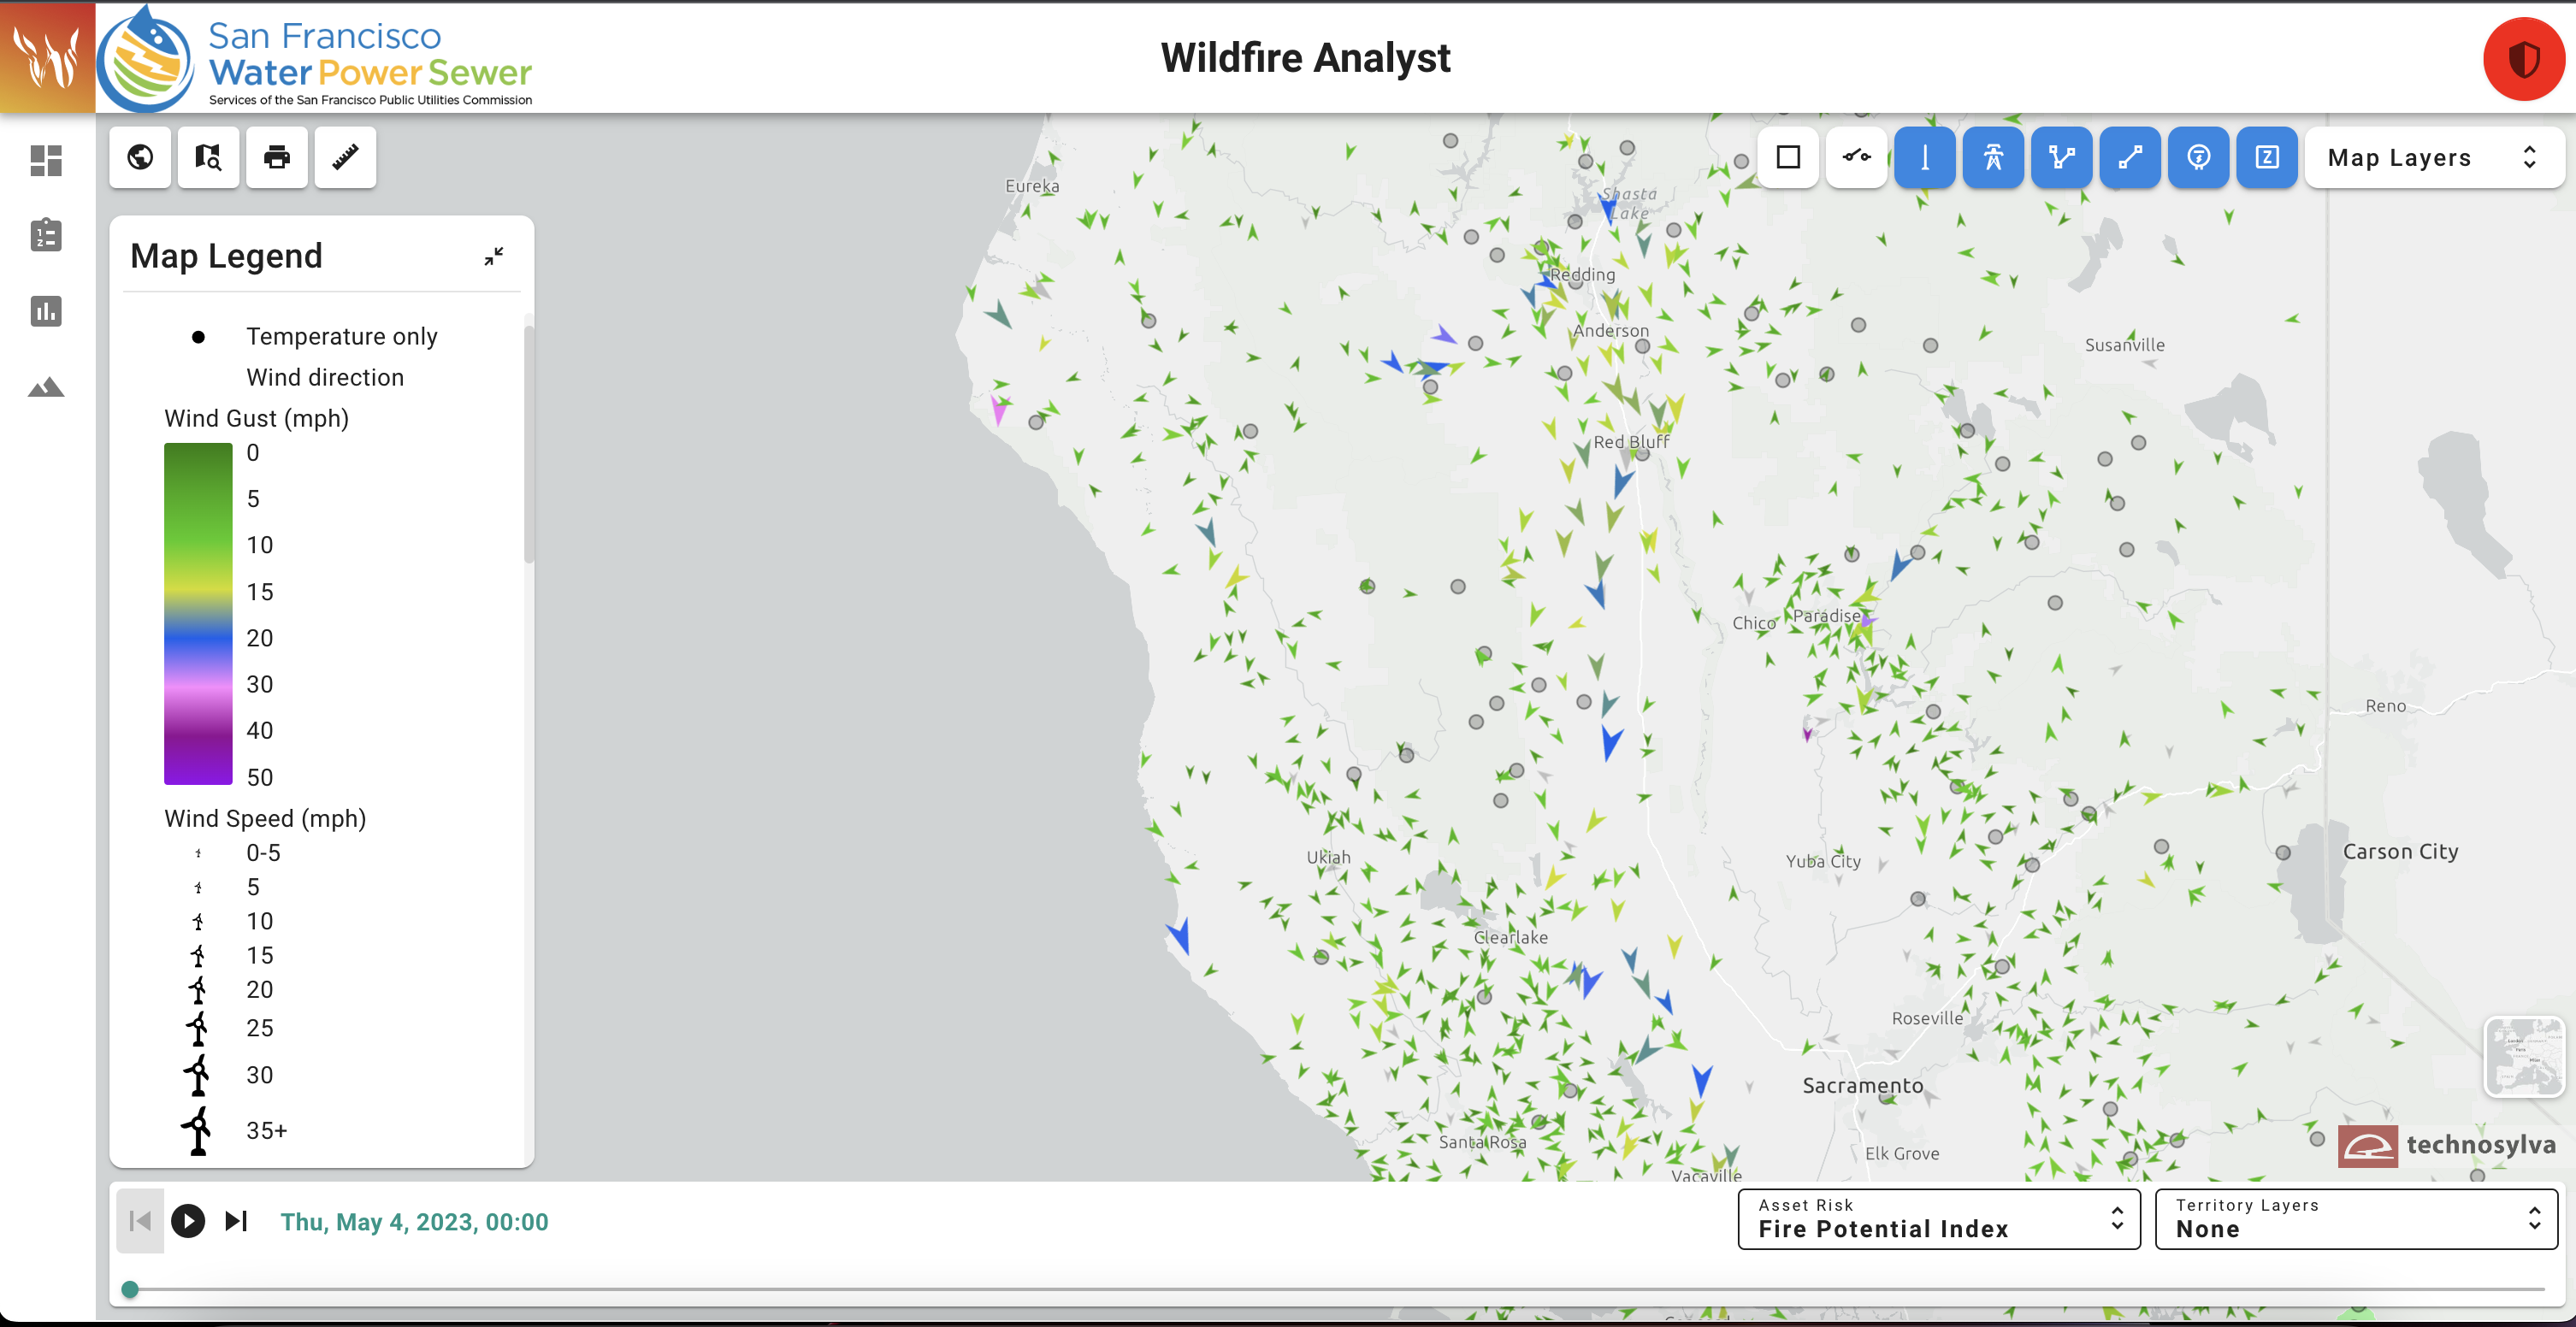
Weather Station Layer displayed on map