Map Reference Layers: Definitions and Sources
Weather Stations
Real-time weather data is available when the weather stations layer is toggled on. Arrow icons will appear on the map, symbolizing the latest wind direction data at that location. Click on these arrow icons to see a pop-up window for the latest temperature, humidity, wind speed, and wind direction data. Access historical weather data by clicking the “Station Details” button, which takes you to the station’s historical data displayed by the National Weather Service. Weather Station Source: Synoptic. Weather station networks available through Synoptic include ASOS, RAWS, PG&E, SCE, and SDG&E, and most weather stations update at 15-minute intervals. Details on all available networks and providers are listed here.
Active Fire Incidents
Turn this layer on to view active fire incidents, which will load as red fire icons. Click on these fire icons for a pop-up window with current fire details and dispatch center that reported the incident. Active Incidents Source: IRWIN - Integrated Reporting of Wildland Fire Information. View the full list of dispatch centers here.
Cameras
Live webcams offer added situational awareness by providing visibility throughout the service territory. When the layer is toggled on, click the camera icons for pop-up window that shows the latest image from that location, and click the “More Information” button for more details on the cam, such as camera direction and previous images. Camera Source: ALERTCalifornia, which includes cameras maintained by CAL FIRE, PG&E, SCE, and SDG&E.
MODIS 48hrs
This layer provides the last 48 hours of thermal activity detected by the MODIS sensors on NASA AQUA and Terra Satellites to visualize and assess wildfire locations worldwide at a 1km spatial resolution. Click on the red dot icons to view the specific satellite-detected details. Note that this technology detects other hotspots such as volcanoes and gas flares. Source: MODIS - Thermal Detection, Last 48 hours.
VIIRS Hotspots
This layer provides another source for satellite detected wildfires. The Visible Infrared Imaging Radiometer Suite (VIIRS) detects any thermal hotspots, such as wildfires, volcanoes, and gas flares, but at a higher spatial resolution (375m) which has improved capabilities for detecting small fires. VIIRS sensors are aboard the Suomi NPP and NOAA-20 satellite missions. When this layer is on, orange dots will populate the map and fade as time passes. Click on these icons for a pop-up window for specific details on these satellite-detected hotspots. Source: VIIRS - Thermal Hotspots and Fire Activity
Air Quality Index (AQI)
The AQI layer displays all official particulate matter monitoring sites on the map. Particulate matter (PM) is the main component of wildfire smoke and defined by the particle size. PM2.5 are particles 2.5 micrometers or less in diameter, and are small enough to be inhaled into the respiratory system, causing the greatest risk of wildfire smoke to public health, thus it is important to monitor during active wildfires. The color and number that appears on the icons correspond to the index level as defined in the map legend. Click on these icons to view a pop-up window with the details for each monitoring site, such as timestamp and particle size of pollutants measured. Most monitoring sites are updated hourly. Source: AirNow.
Responsibility Area
This layer is a useful reference tool to view responsible agency coverage areas plotted throughout the state of California. The colors are defined in the map legend, and defined as either local, state, or federal responsibility. Source: CA.gov.
PG&E Fire Index Areas
PG&E has divided their service territory into Fire Index Areas and has provided permission for Technosylva to display these areas in FireRisk Web as a general reference layer. Source: PG&E.
NWS Fire Weather Zones
National Weather Service (NWS) zones are defined and labeled on the map as a helpful reference tool to identifying fire weather zone boundaries and IDs. The NWS references these zone IDs in Red Flag Warnings, Fire Weather Watches, and Fire Weather Planning Forecasts. Source: NWS.
Fire Behavior Potential (formerly referred to as Burning Index or BI)
This reference layer provides a national map that is color-coded to depict regions of the country under elevated fire risk for today. BI is a common output of the National Fire Danger Rating System (NFDRS) which combines the fire spread component and energy release component to relate the contribution of fire behavior to the effort of containing a fire. BI Percentages above 90% are regions to be concerned with, and are colored as shades of pink and defined in the map legend. The data output is then translated from BI percentiles to levels of Fire Behavior Potential, with Level V as high risk and Level I as low risk. This layer is updated daily by the USFS Wildland Fire Assessment System. Source: WFAS.
Spatial Preparedness Level (formerly referred to as Energy Release Component or ERC)
This reference layer provides a national map that is color-coded to depict regions of the country under elevated fire risk for today. ERC is another common output of the National Fire Danger Rating System (NFDRS), based on the estimated potential available energy released per unit area in the flaming zone of a fire. Uniquely, ERC represents the cumulative impact that fuels may have on fire by quantifying all fuel contributions including live and dead categories. Daily variations of ERC are caused by changes in fuel moisture, including the 1000 hour time lag class. ERC is derived from predictions of the rate of heat release per unit area during flaming combustion and the duration of the burning. The data output is then translated from ERC percentiles to Spatial Preparedness Levels, with Level VI as the highest fire risk and Level I as little to no fire risk. This layer is updated daily by the USFS Wildland Fire Assessment System. Source: WFAS.
Severe Fire Danger Index
This reference layer provides a national map that is color-coded to depict regions of the country under severe fire danger risk for today. The two most informative and comprehensive outputs from the National Fire Danger Rating System (NFDRS) are the Burning Index (BI) and Energy Release Component (ERC). The Severe Fire Danger Index (SFDI) summarizes ERC and BI by combining the highest historic percentiles of each, and the resulting SFDI has been shown to identify more than 75% of firefighter entrapments within the very high and critical categories. SFDI summaries are simple and easily digestible with five categories from low to severe that are plotted as colors on the map, and defined accordingly in the map legend. This layer is updated daily by the USFS Wildland Fire Assessment System. Source: WFAS.
Active Fire Perimeters
Turn this layer on to view the perimeters for active fire incidents, which will load as red hatched regions. Click on these areas for a pop-up window with the complete fire details and dispatch center that reported the incident. Active Fire Perimeters Source: IRWIN - Integrated Reporting of Wildland Fire Information. View the full list of dispatch centers here.
High Fire Threat Districts
This reference layer is useful to understand where the California Public Utility Commission (CPUC), in collaboration with CAL FIRE and USFS, has identified areas of high fire threat across California - Tier 2 (elevated risk from wildfires) and Tier 3 (extreme risk from wildfires). When this layer is turned on, these regions will populate the map and are defined in the map legend. When a region is clicked, a pop-up window will provide the tier level it has been assigned. Source: CPUC.CA.gov
Watches and Warnings
Turn on this map layer for general situational awareness from a weather perspective. This will plot all National Weather Service (NWS) Watches and Warnings across the entire US. Colors are defined in the map legend; and by clicking the colored areas, a pop-up window will load the complete weather details including time issued, counties affected, and weather concern. Click the “More Information” button to learn more on this weather hazard from the local NWS office that issued the alert. Source: NWS.
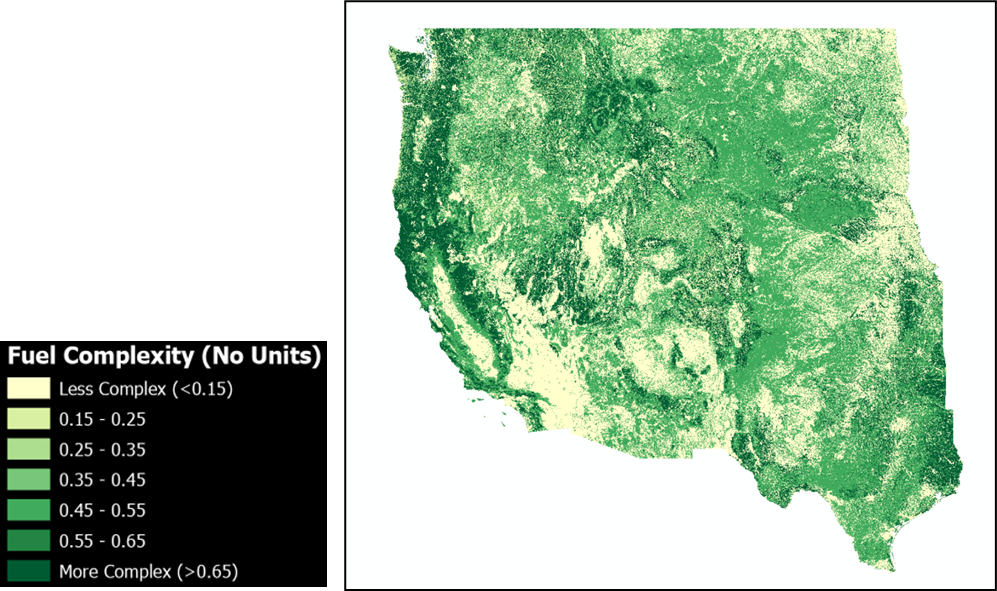
Fuel Model Complex (FMComplex)
Fuel model complex is a measure of the fuel model loads and age present in the territory. We plan to include pest impacts in the next update too. This metric weighs the type of structure, its load and the time elapsed since the last fire to quantify how the fuel model may affect fire behavior, fire type and fire suppression difficulty. It is scaled between values 0 and 1 and the nominal resolution is 30 m. We used the Technosylva fuel maps when available and LandFire in those States where Technosylva has not developed high-resolution fuel maps yet.
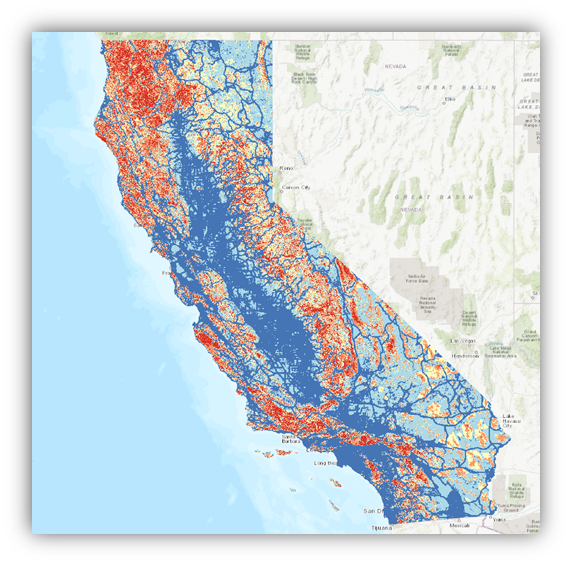
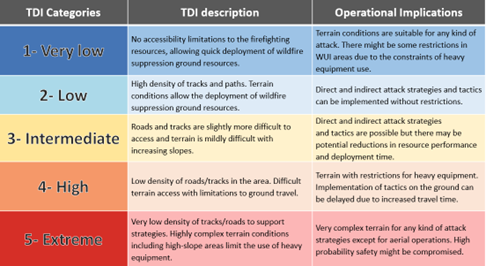
Terrain Difficulty Index (TDI)
TDI includes the Accessibility, Penetrability and Fireline Opening Indexes. It is scaled between unique values 1 and 5 and the nominal resolution is 30 m.
Fuel Model
The Technosylva fuel models are defined here.
Fireguard
Fireguard uses military satellites with the National Interagency Fire Center, U.S. Forest Service and the National Geospatial-Intelligence Agency’s Firefly capability to detect wildfires, notify authorities, and create products to disseminate to firefighting networks nationwide. When this layer is toggled on, the Fireguard fire perimeters display on the map and are color-coded according the age of the fire perimeter from 2 hours old to more than 48 hours old. This data is updated daily within the WFA FireRisk application. Click here for more information on Fireguard.
Snow Cover
The Snow Cover layer is a CONUS-wide product derived from Snow Data Assimilation System (SNODAS) product. This source updates daily and notes a 1-day lag. You can find more information here.
Snow cover is displayed by using the "Snow depth" variable, filtered to a 2 cm minimum depth, to consider that the pixel is fully covered by snow. This snow cover layer (snow/no snow) is then used in our Dead Fuel Moisture and risk calculations.