New! Circuit Level Forecast Tool
Circuit Level Forecast Tool
Upon the first time loading the tool, the panel will be empty, as no queries have been established:
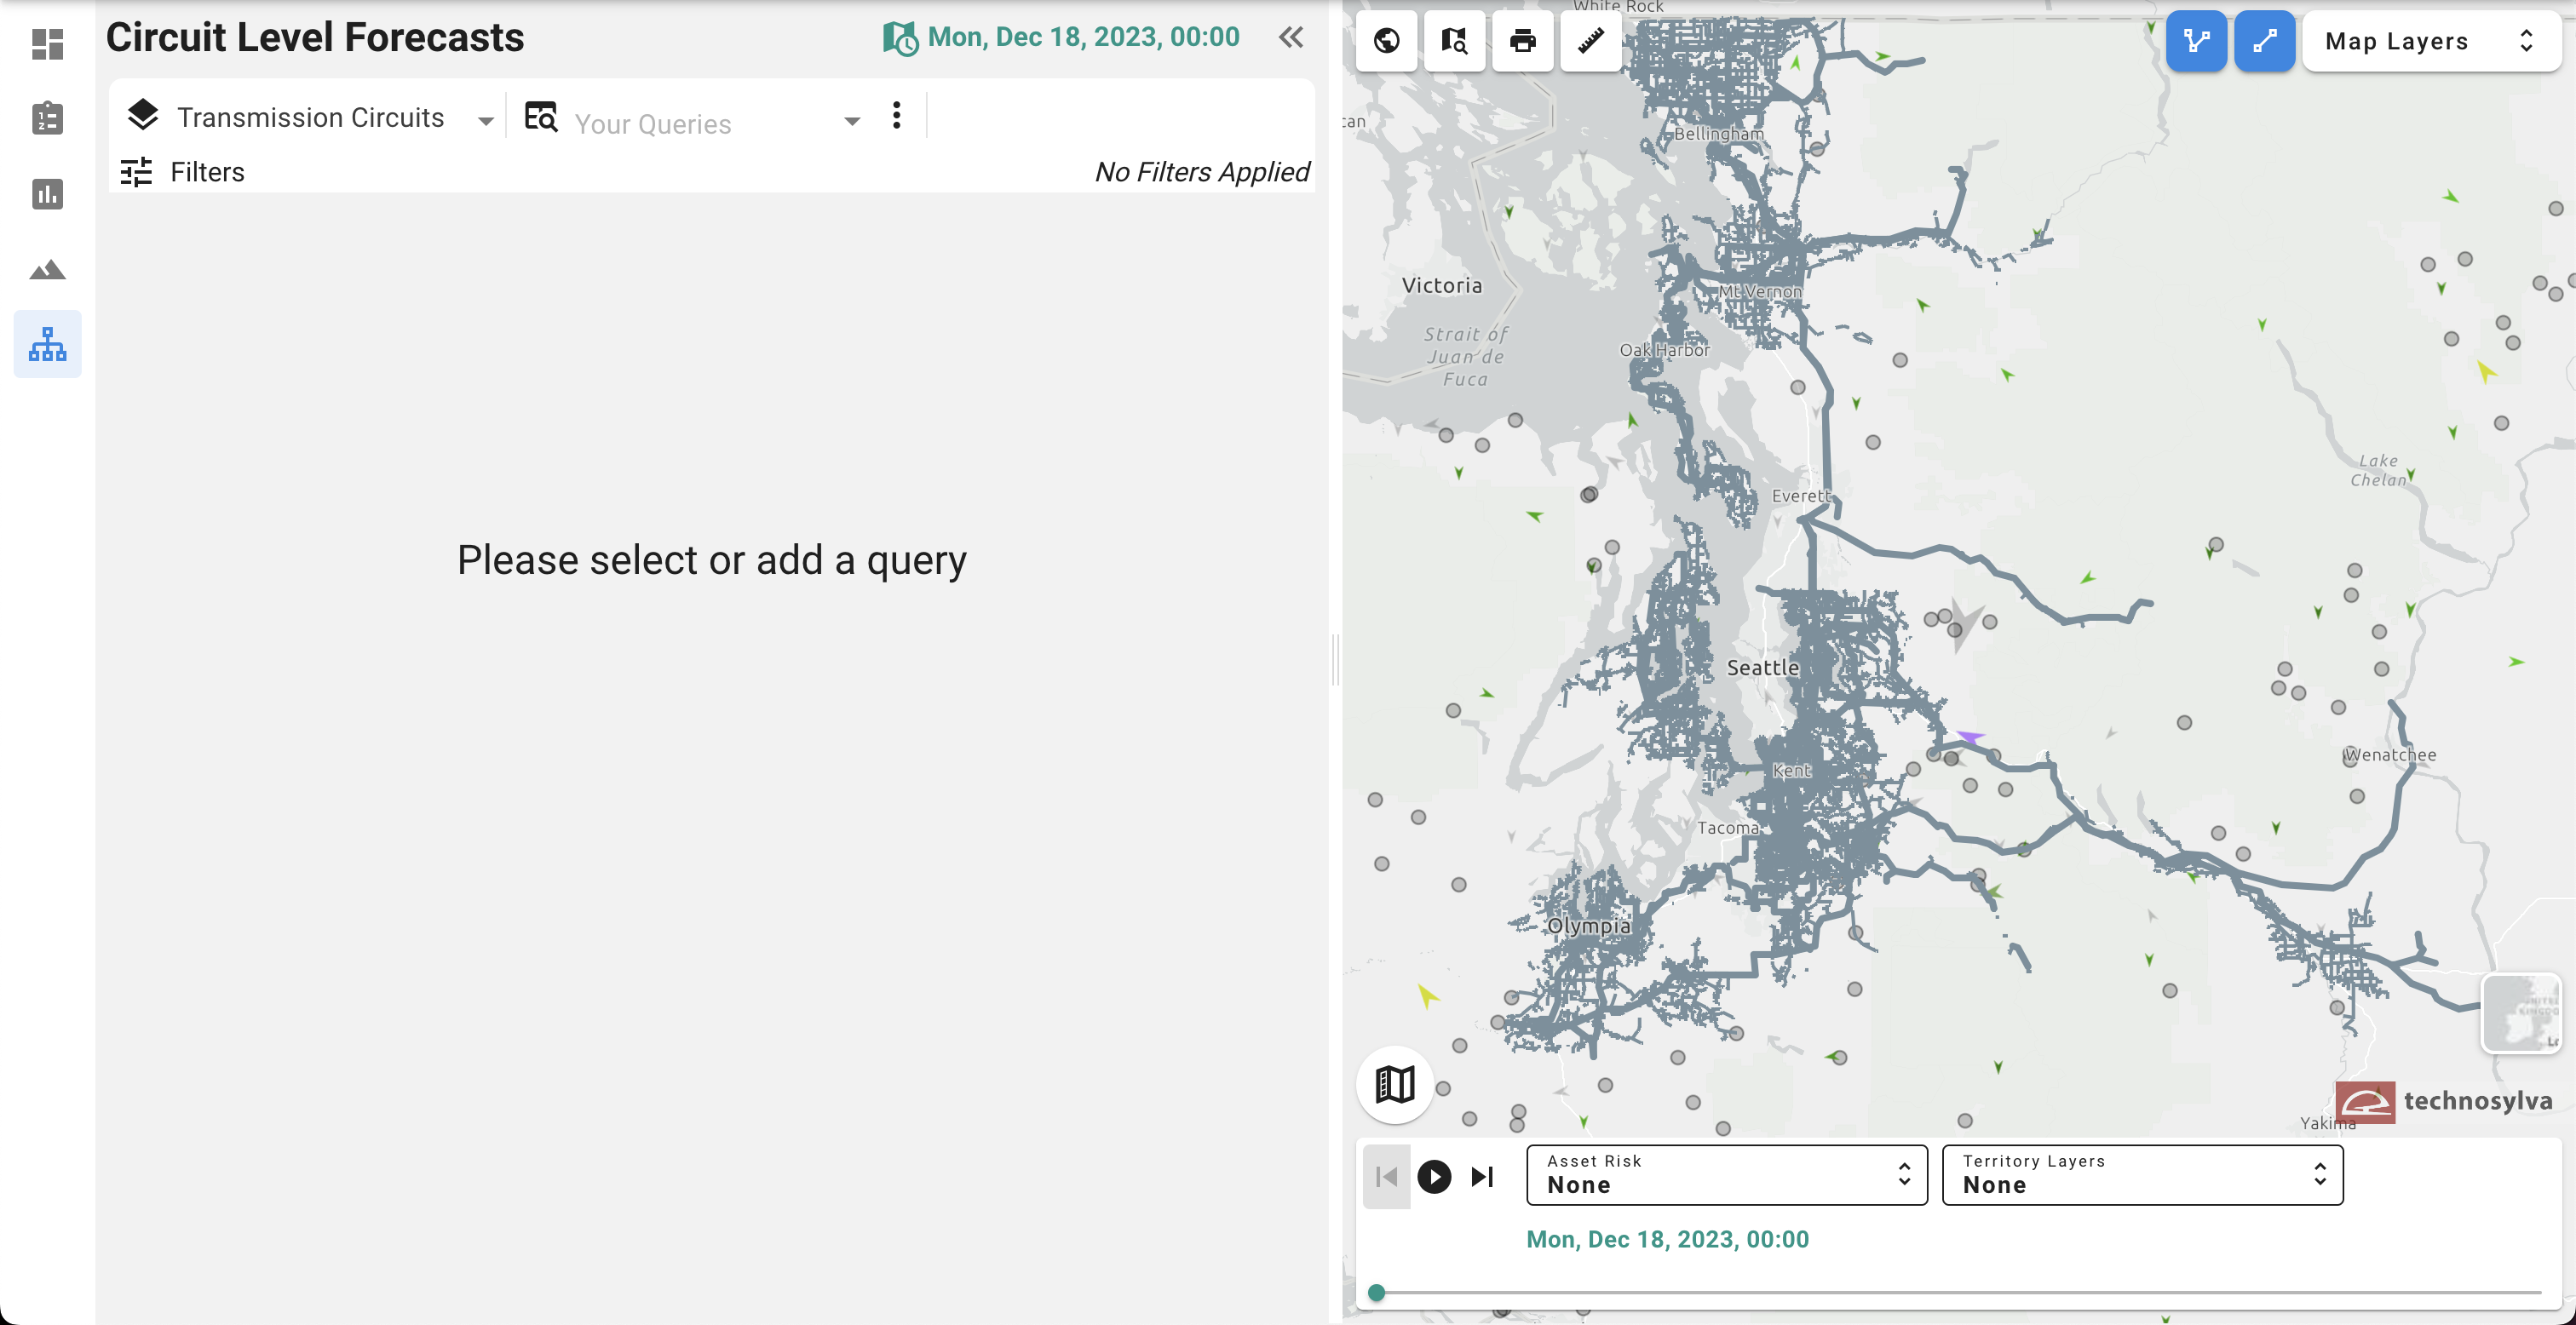
Circuit Forecast Tool
Start a query:
At the top of the panel, you’ll see a circuit drop-down list. Make sure you have selected the assets you intend to have the query apply to. Next, click the three vertical dots to the right of “Your Queries” to “Add new query”. A pop-up window will appear to allow the user to create a query and apply thresholds to various risk metrics and weather conditions.
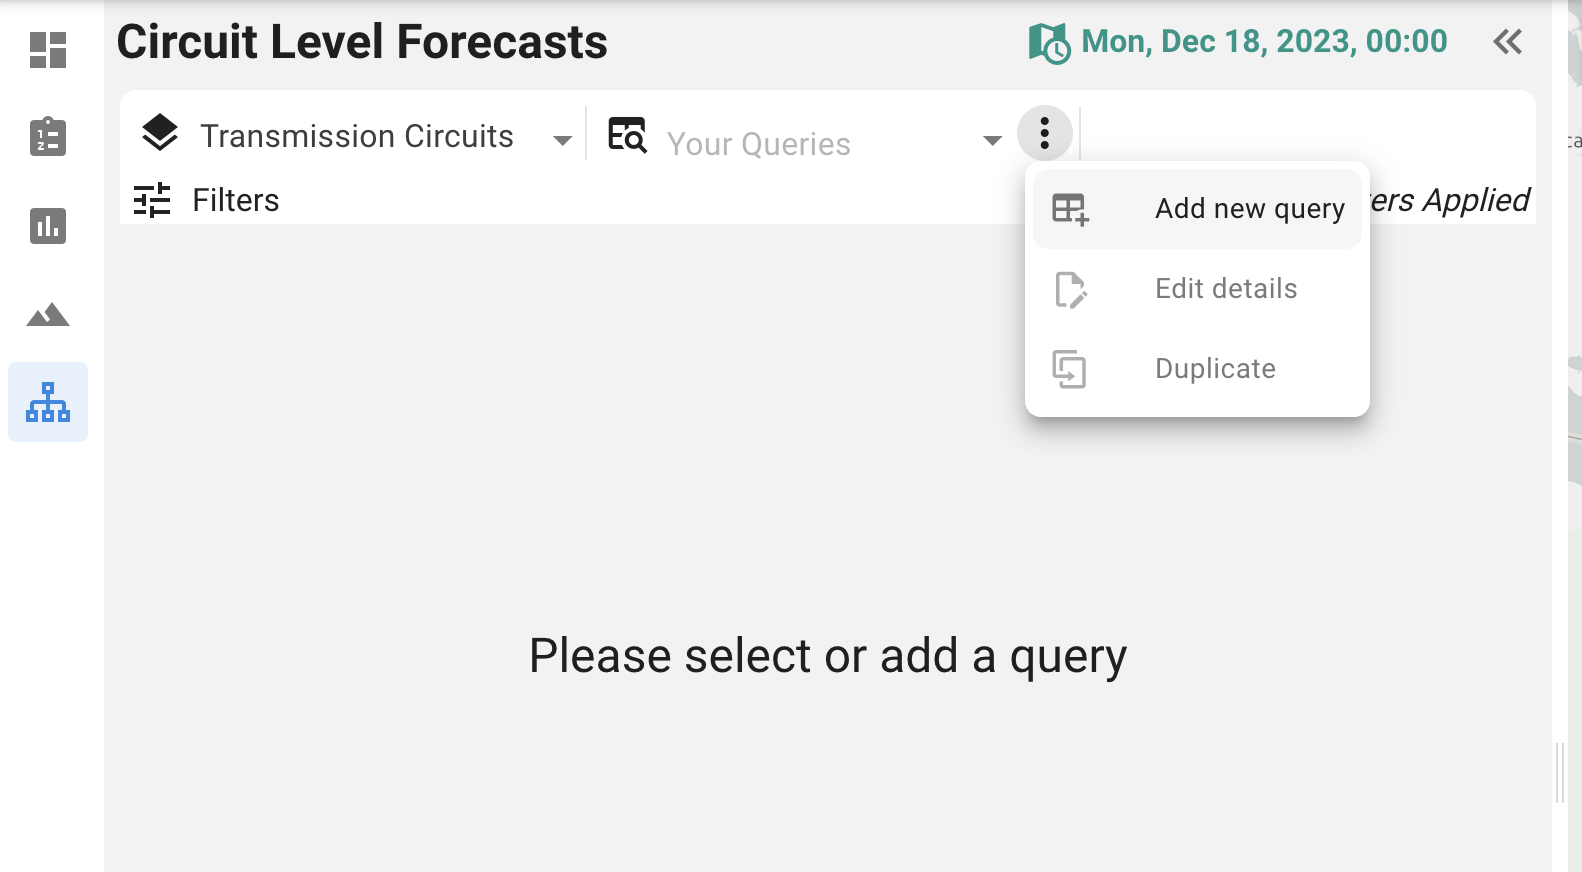
Add new query
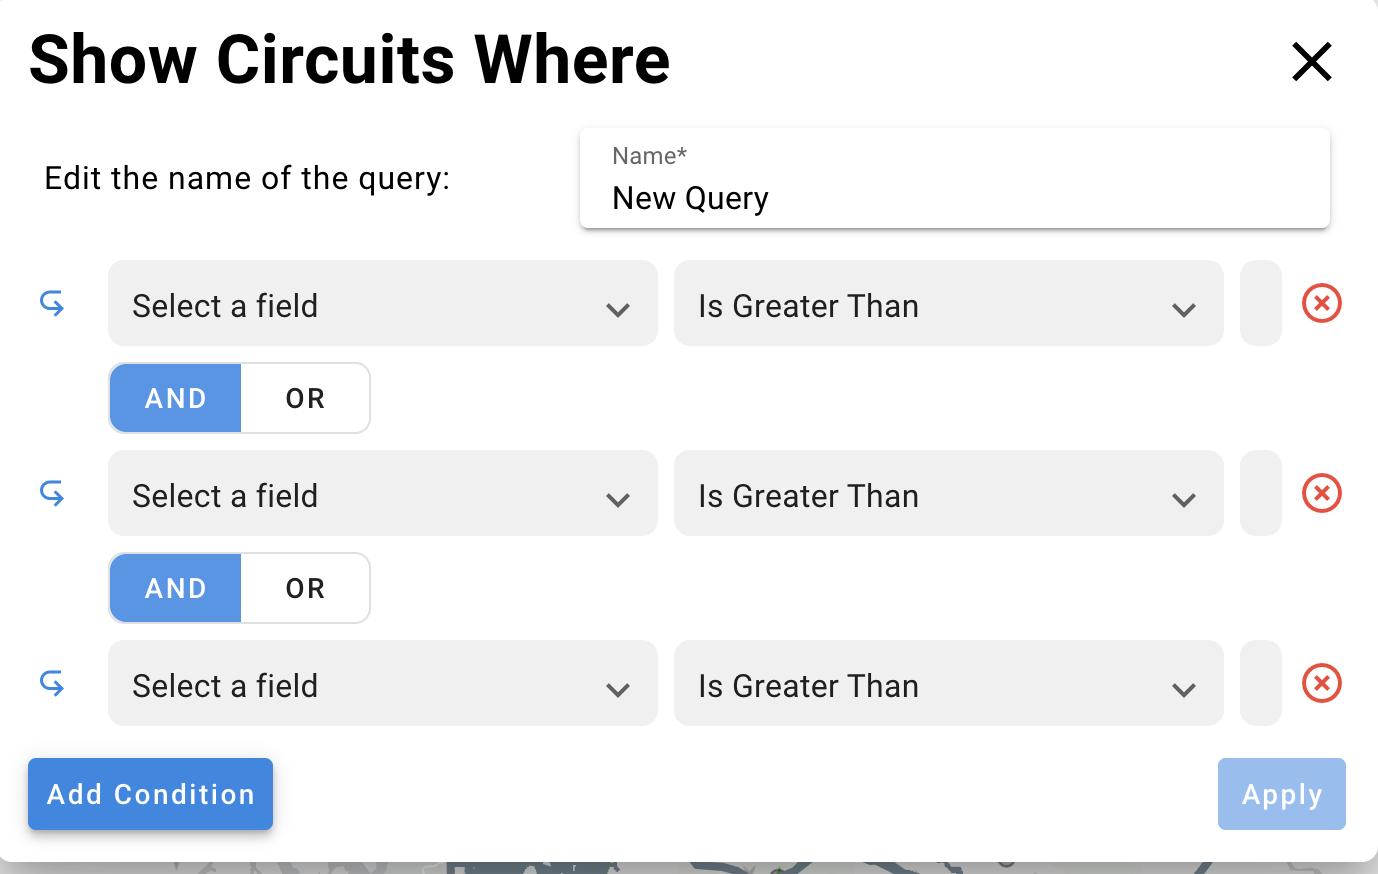
New Query Panel
Create a Query:
Complete the fields in the pop-up window to name your query, set the thresholds for your metrics and values, then hit apply. Use the Add Condition button to add a new threshold line, and use the “And” “Or” buttons to apply the appropriate logic to your query. Click “Apply” to view the results of this query.
Save a Query:
Load the query results in the data panel to the left of the map, under the circuit-level forecast tool icon.

Circuit Forecast Tool Tab
Review the results of the query to identify the circuits selected. A timeline loads at the top of the list to show how many circuits meet the defined criteria at every 3-hour time slice throughout the forecast period. Click through the timeline to load the specific circuits and details for each time slice. From here you can further examine the asset details, zoom into the asset locations, export the list, and save or discard the query.
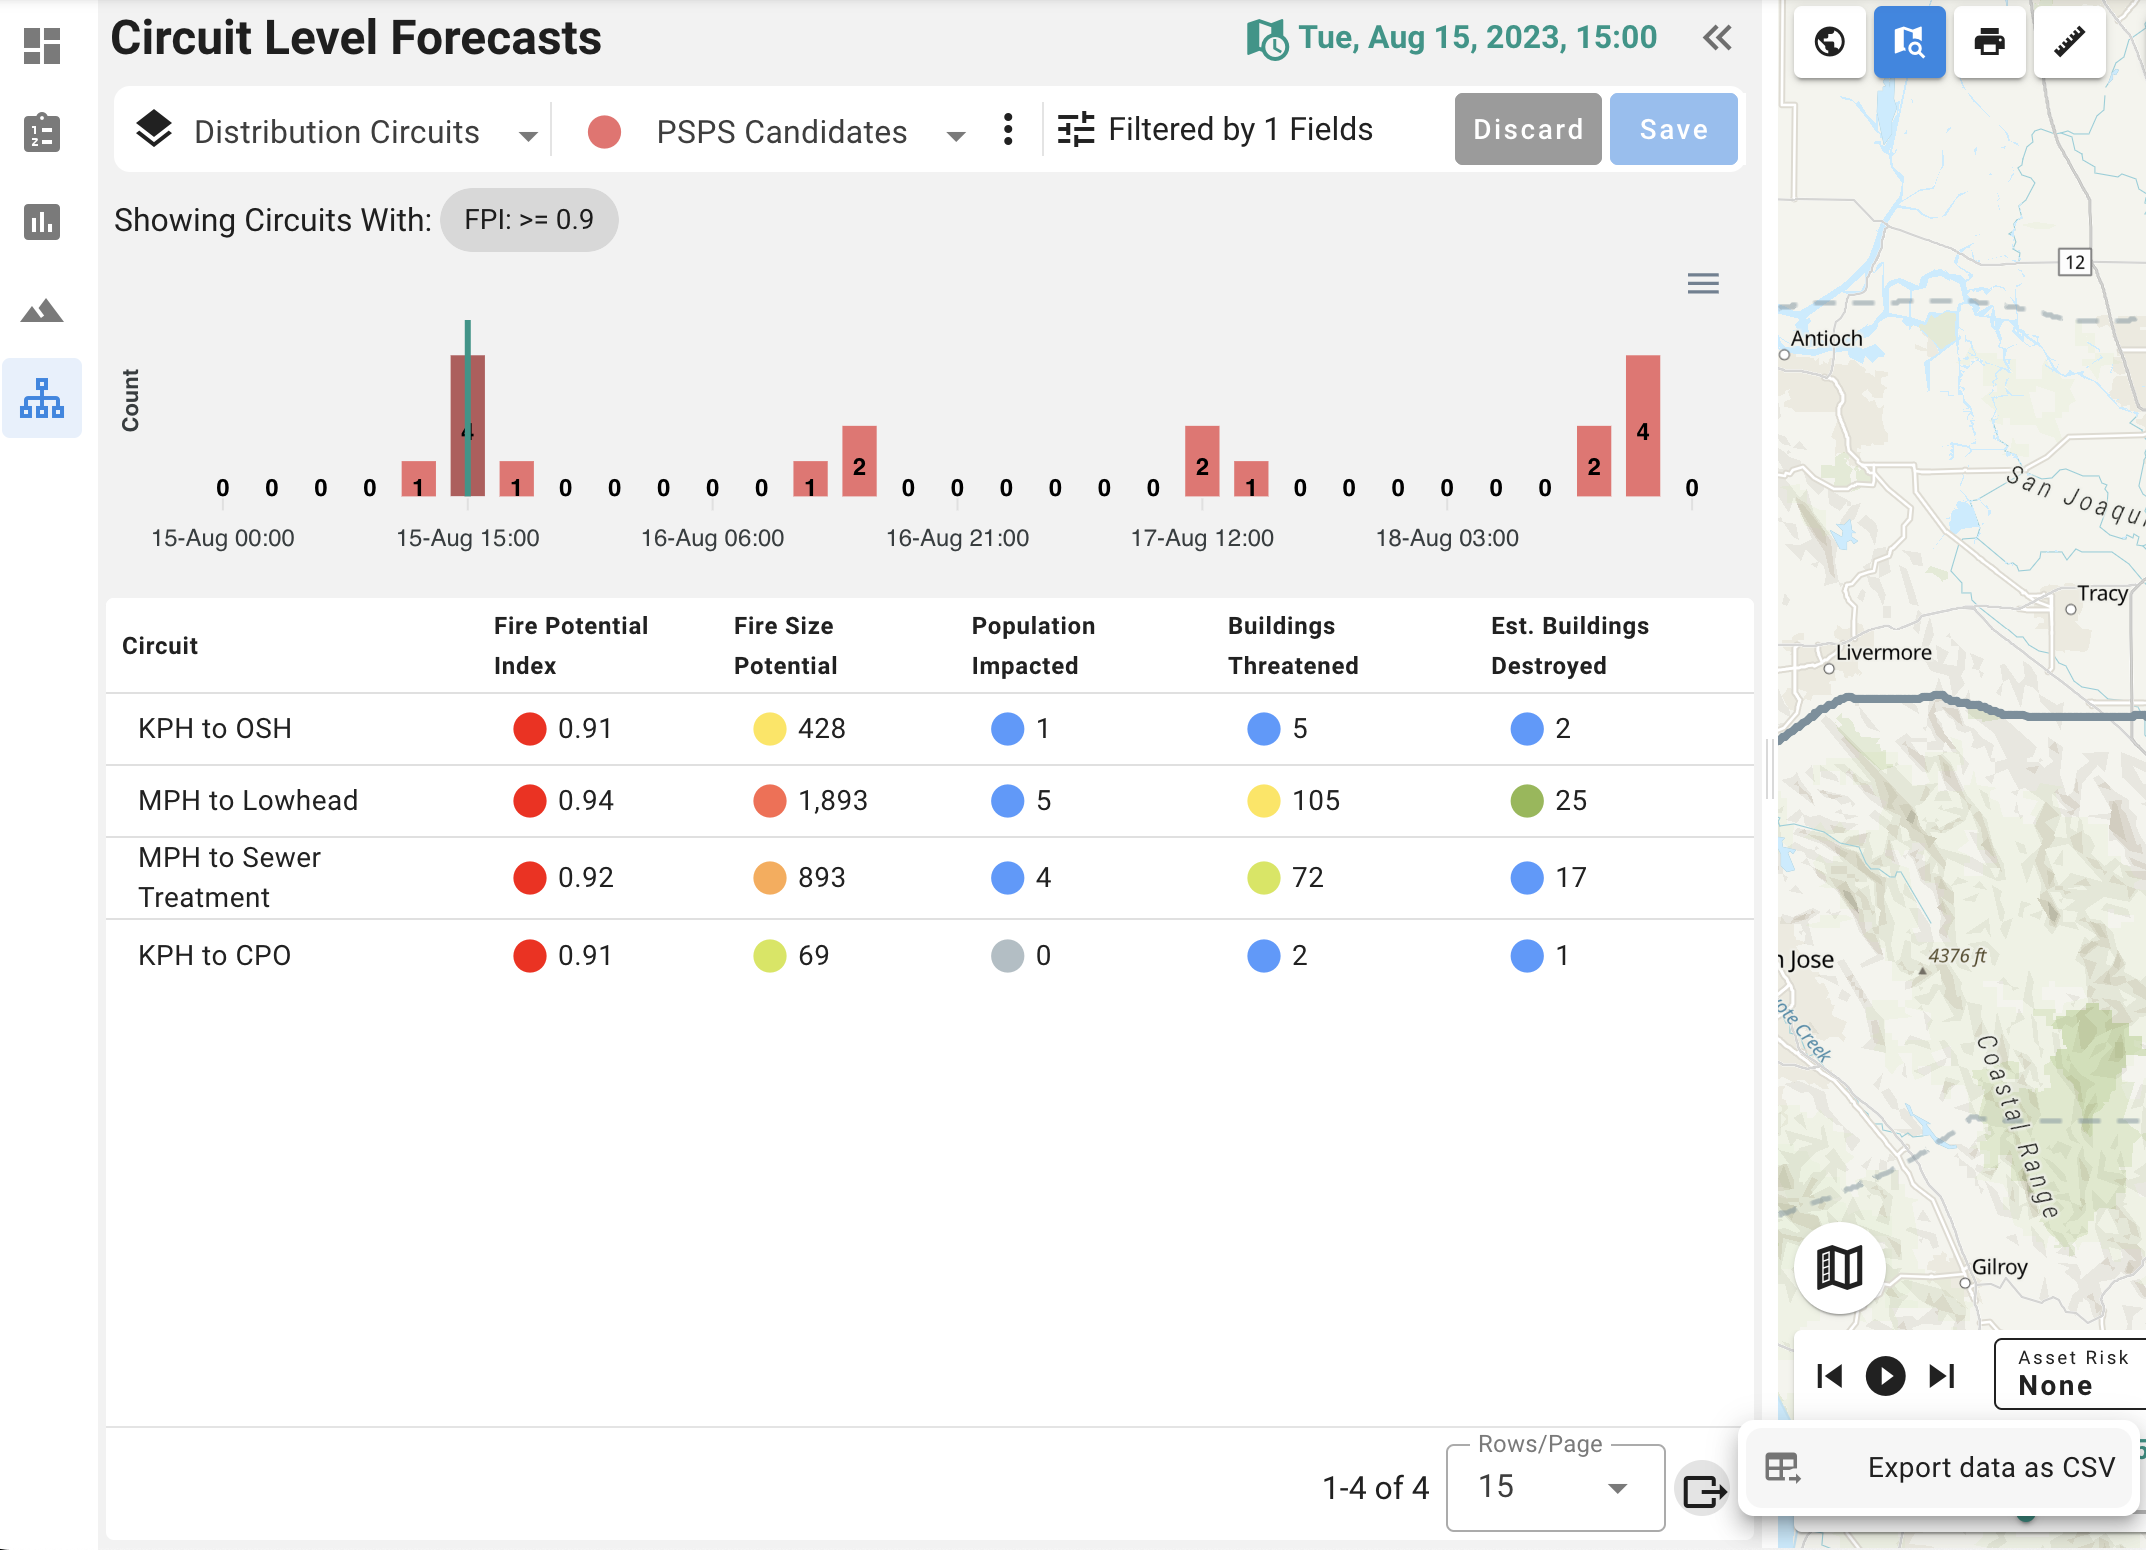
Query results
When you save the query, a new pop-up window appears to offer a query description field and color-coding your queries. Complete the fields in this window and hit “Save” to store the query for future use.
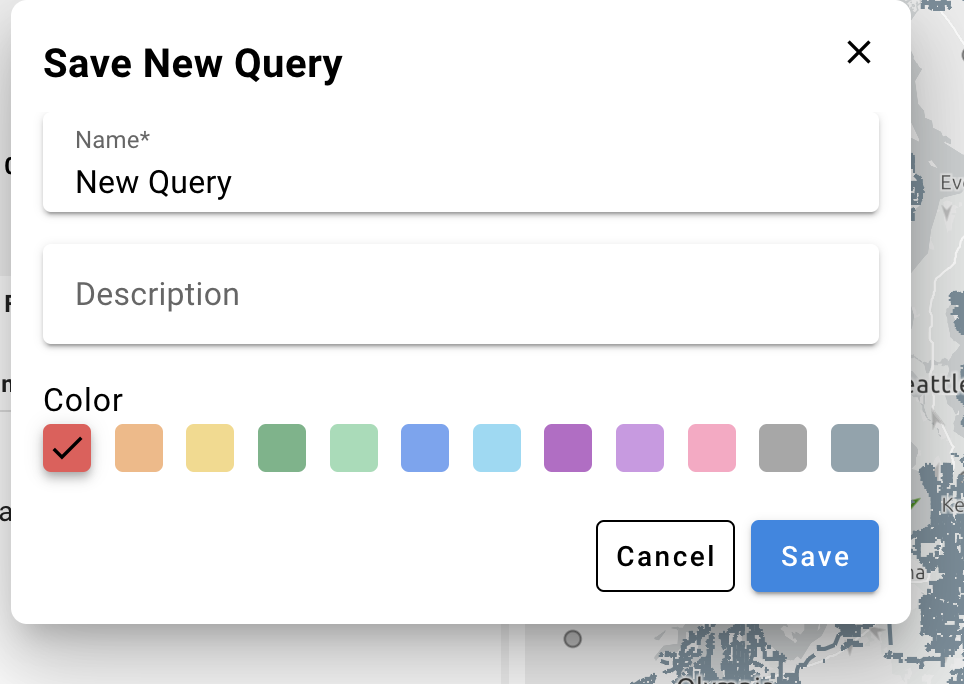
Save query window
Edit a Query:
Queries can be edited and adjusted at any time. Simply click the vertical three dots to the right of the query name to edit the query by either adding new thresholds or adjusting the existing thresholds. Similarly, any query can be duplicated to create a new query or simply deleted if no longer relevant or needed.

Query options
Query Logic:
The Circuit Level Forecast tool allows for advanced query logic through AND/OR grouping functionality. The example below shows an AND/OR grouping.
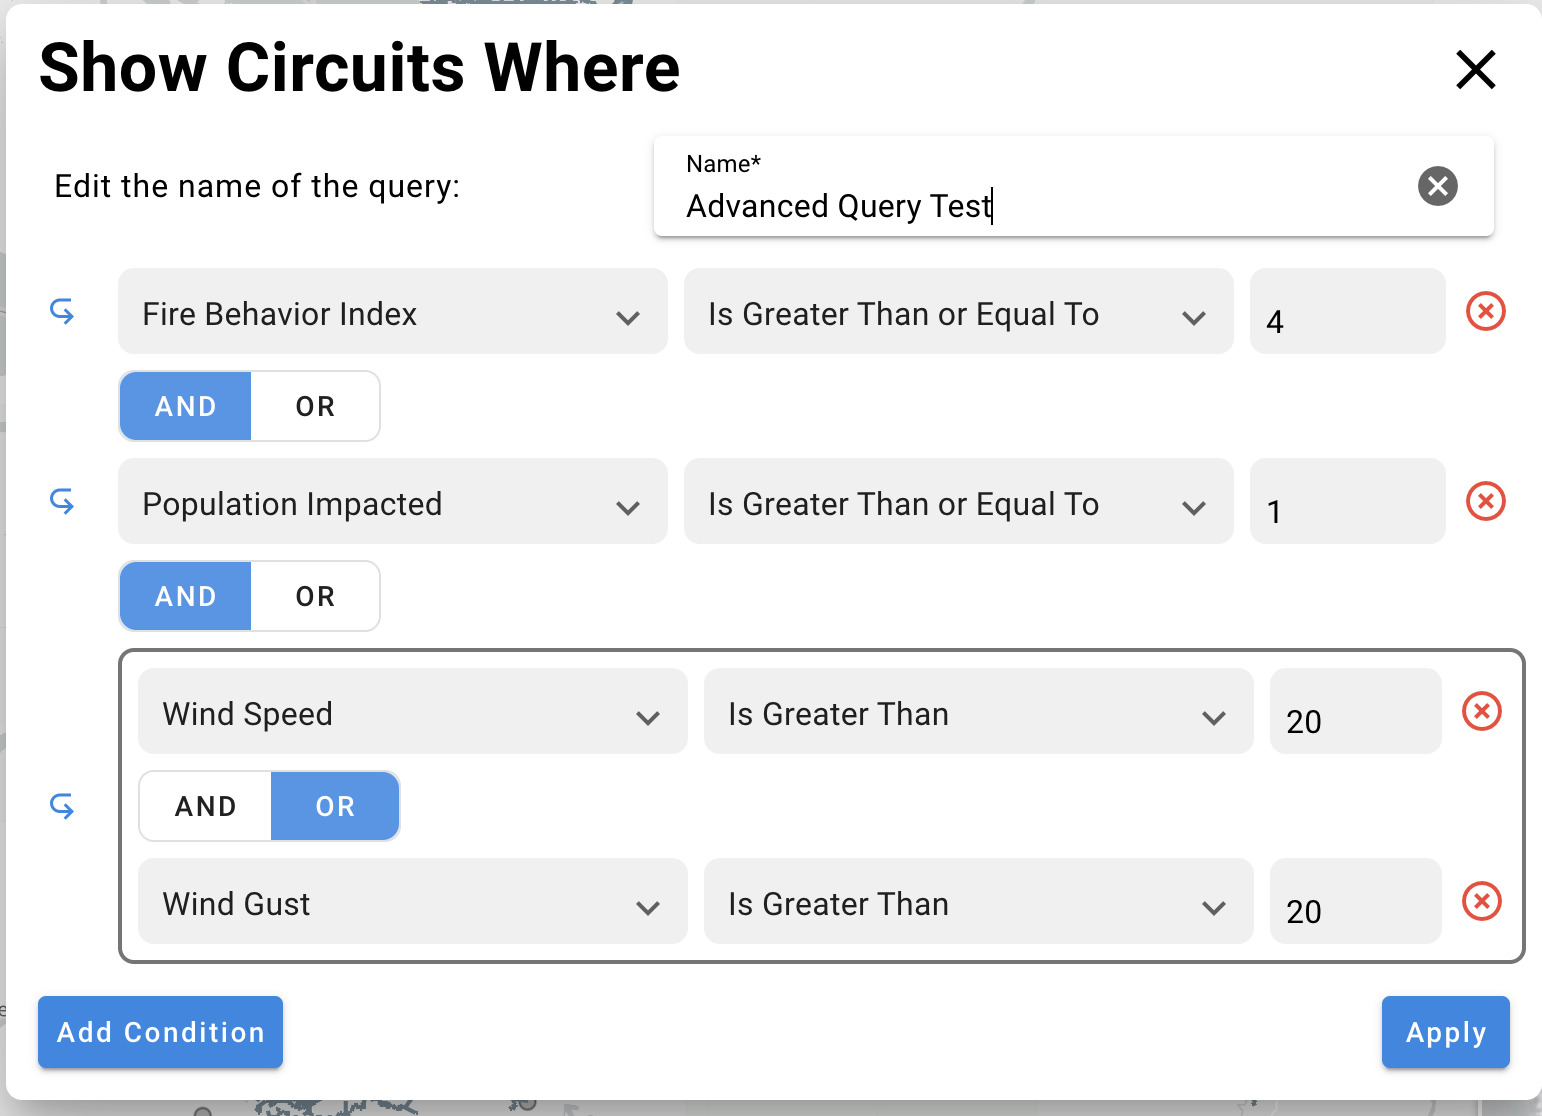
In this case, the query would select any circuit with a Fire Behavior Index of 4 or higher, AND any Population Impacted, AND any Wind Speed OR Wind Gust greater than 20 mph expected throughout the forecast period.
Use the query functionality to identify and create these thresholds to establish various operating procedures. Some examples include:
PSPS Candidates - highlight all circuits that exceed criteria (conditions) for de-energization events.
PSPS Approaching - highlight all circuits that approach your PSPS criteria, and potentially change device settings.
Limit Crew Operations - highlight all circuits under high fire risk conditions to limit or suspend crew operations in the field.
