
User Interface Overview
App Bar

Screen capture of the App Bar (v1.0.0)
The app bar is found at the top of the application. This contains the application name and logo but also contains access to application settings and your account by clicking on
.
Working Panel
The Working Panel is the panel where you will find a list of all of your assets, as well as details and risk metrics about a queried asset. The panel is separated into two tabs - the asset list and the asset details.
The Working panel is always visible but can be resized to allow you to either put more focus on the Map Canvas or Working panel depending on your needs.
Resize The Working Panel
To resize the working panel, click and drag the white bar to the right of the panel and resize the panel as needed.
Resize the map and working panel.
Asset List
Asset list tab selected.
The Asset list displays a list of all of your assets and asset risk metrics for each asset at the selected time. As you cycle through the risk forecast, these risk metrics will update based on the selected time, allowing you to view asset risk over the entire forecasts for individual assets. Learn more about working with the Asset List here.
Asset Details
Example of the asset details tab with a queried asset.
The Asset Details is where you can view all of the risk, weather and fuel moistures metrics for a queried asset. You can view both the risk profile/forecast for the selected asset, as well as metrics for a selected time. Learn more about working with the Asset Details and querying an asset here.
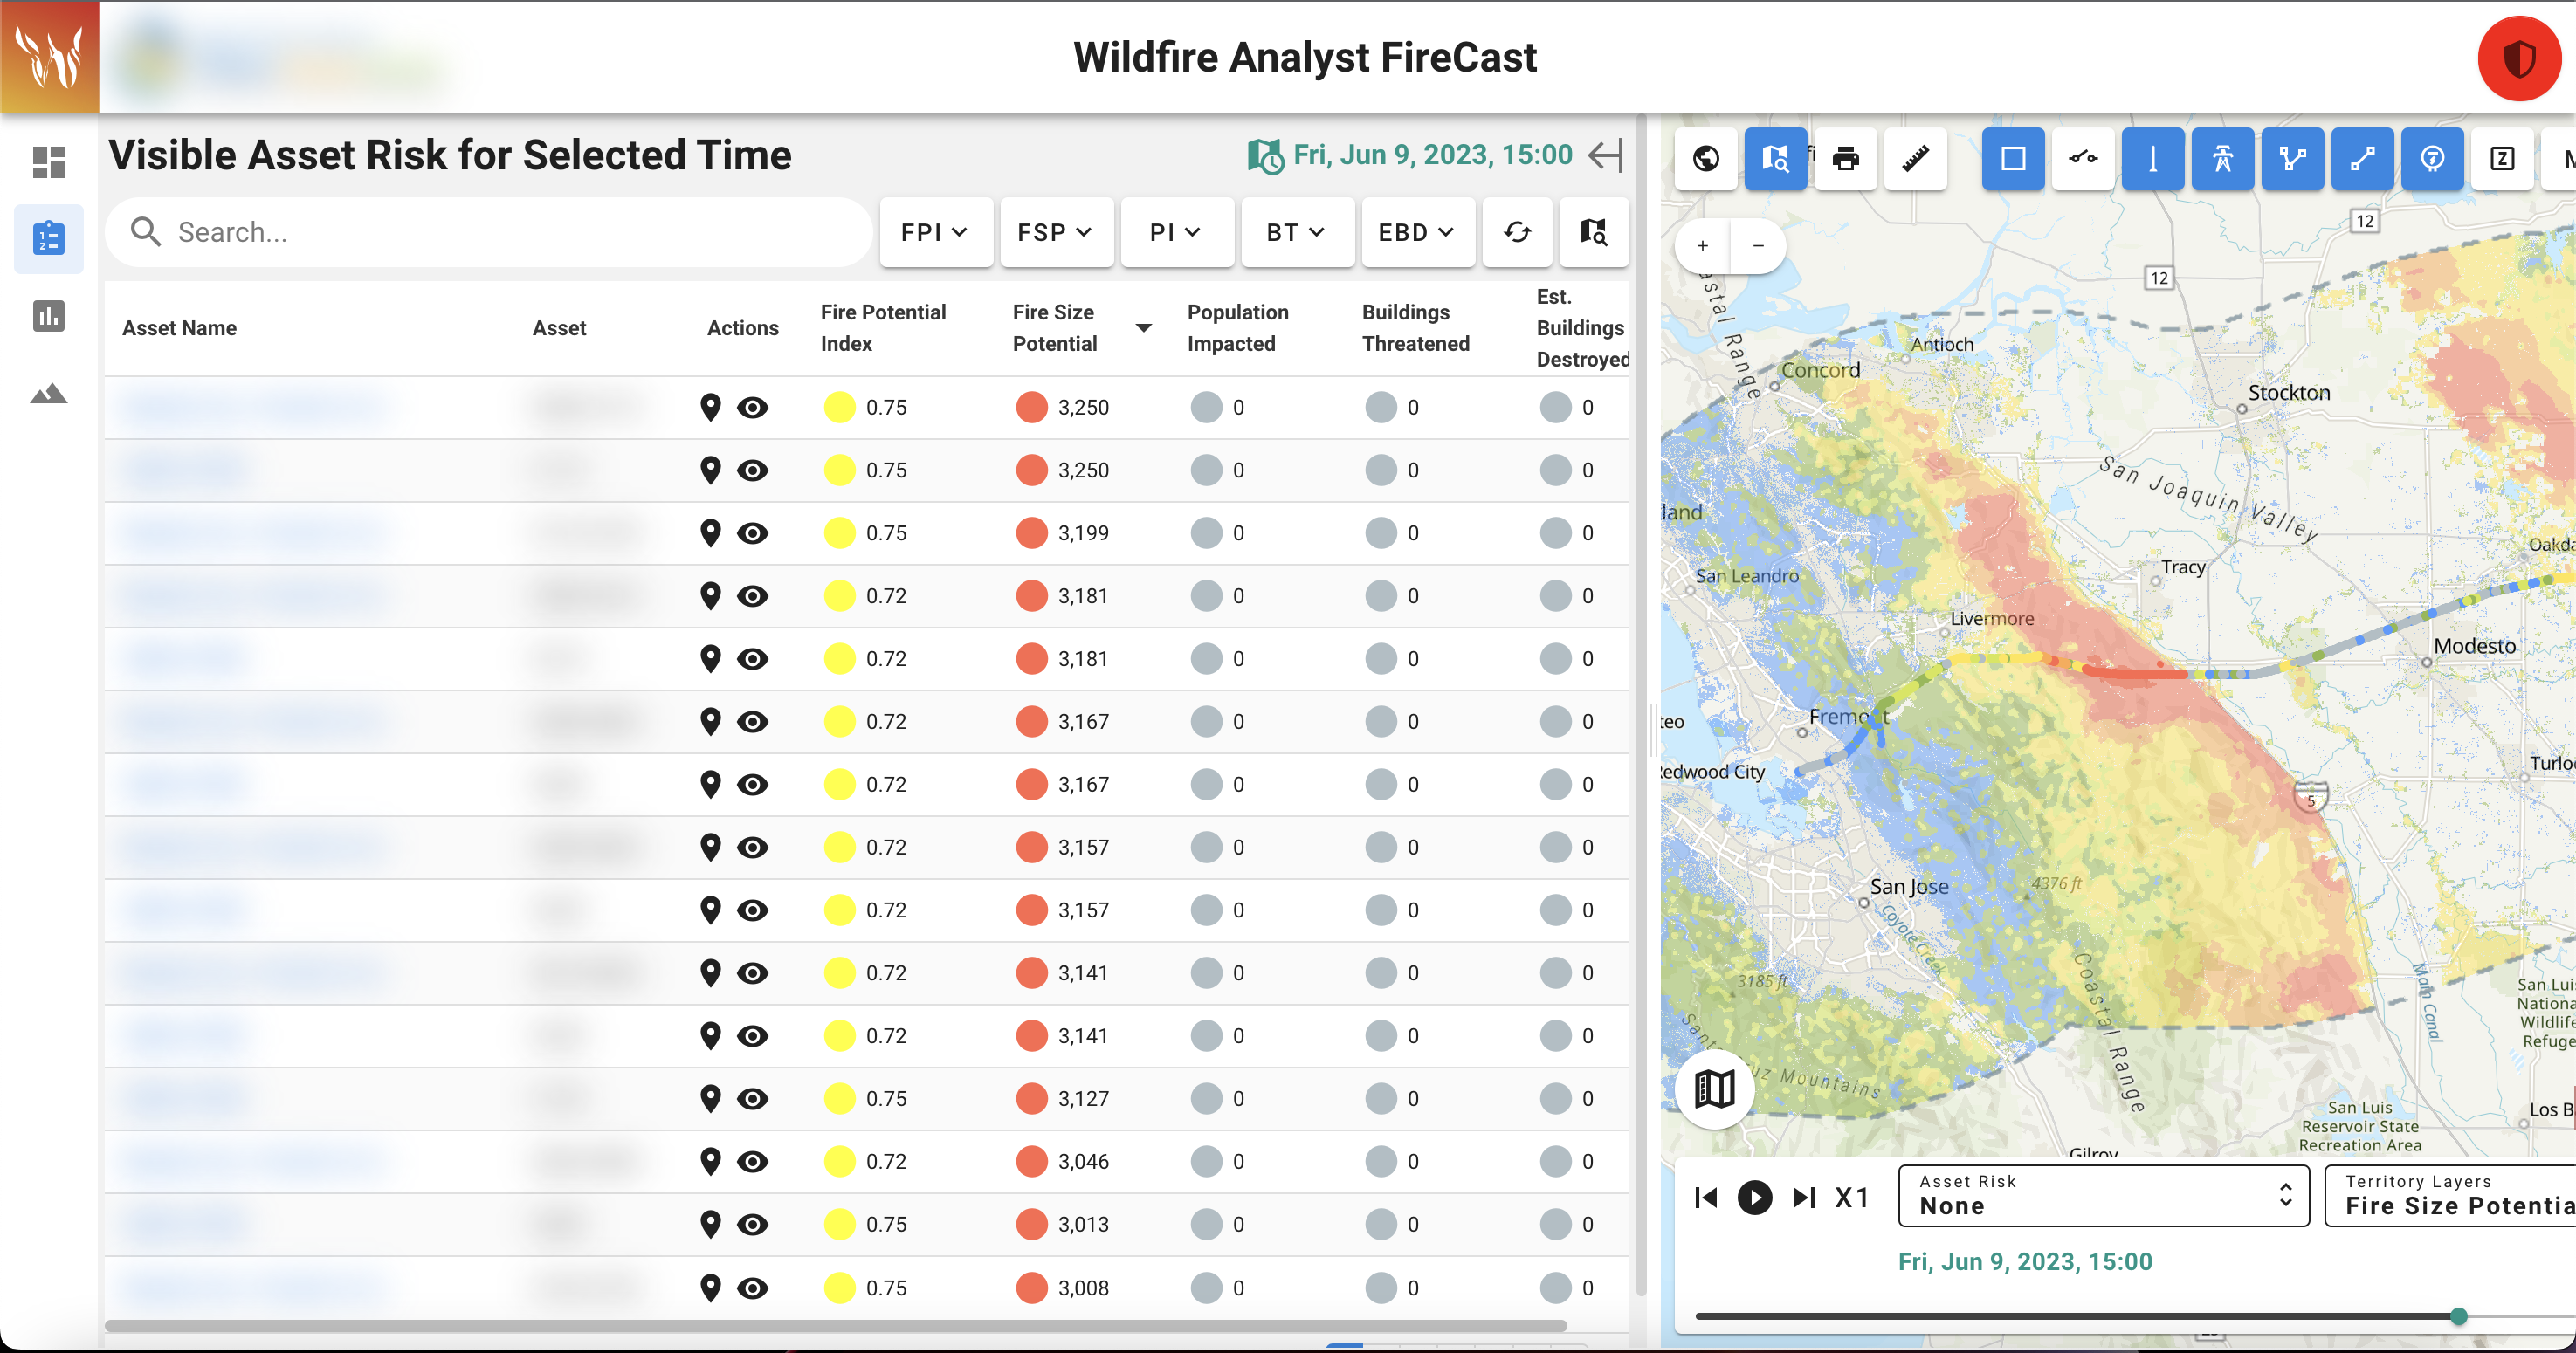
Map Canvas
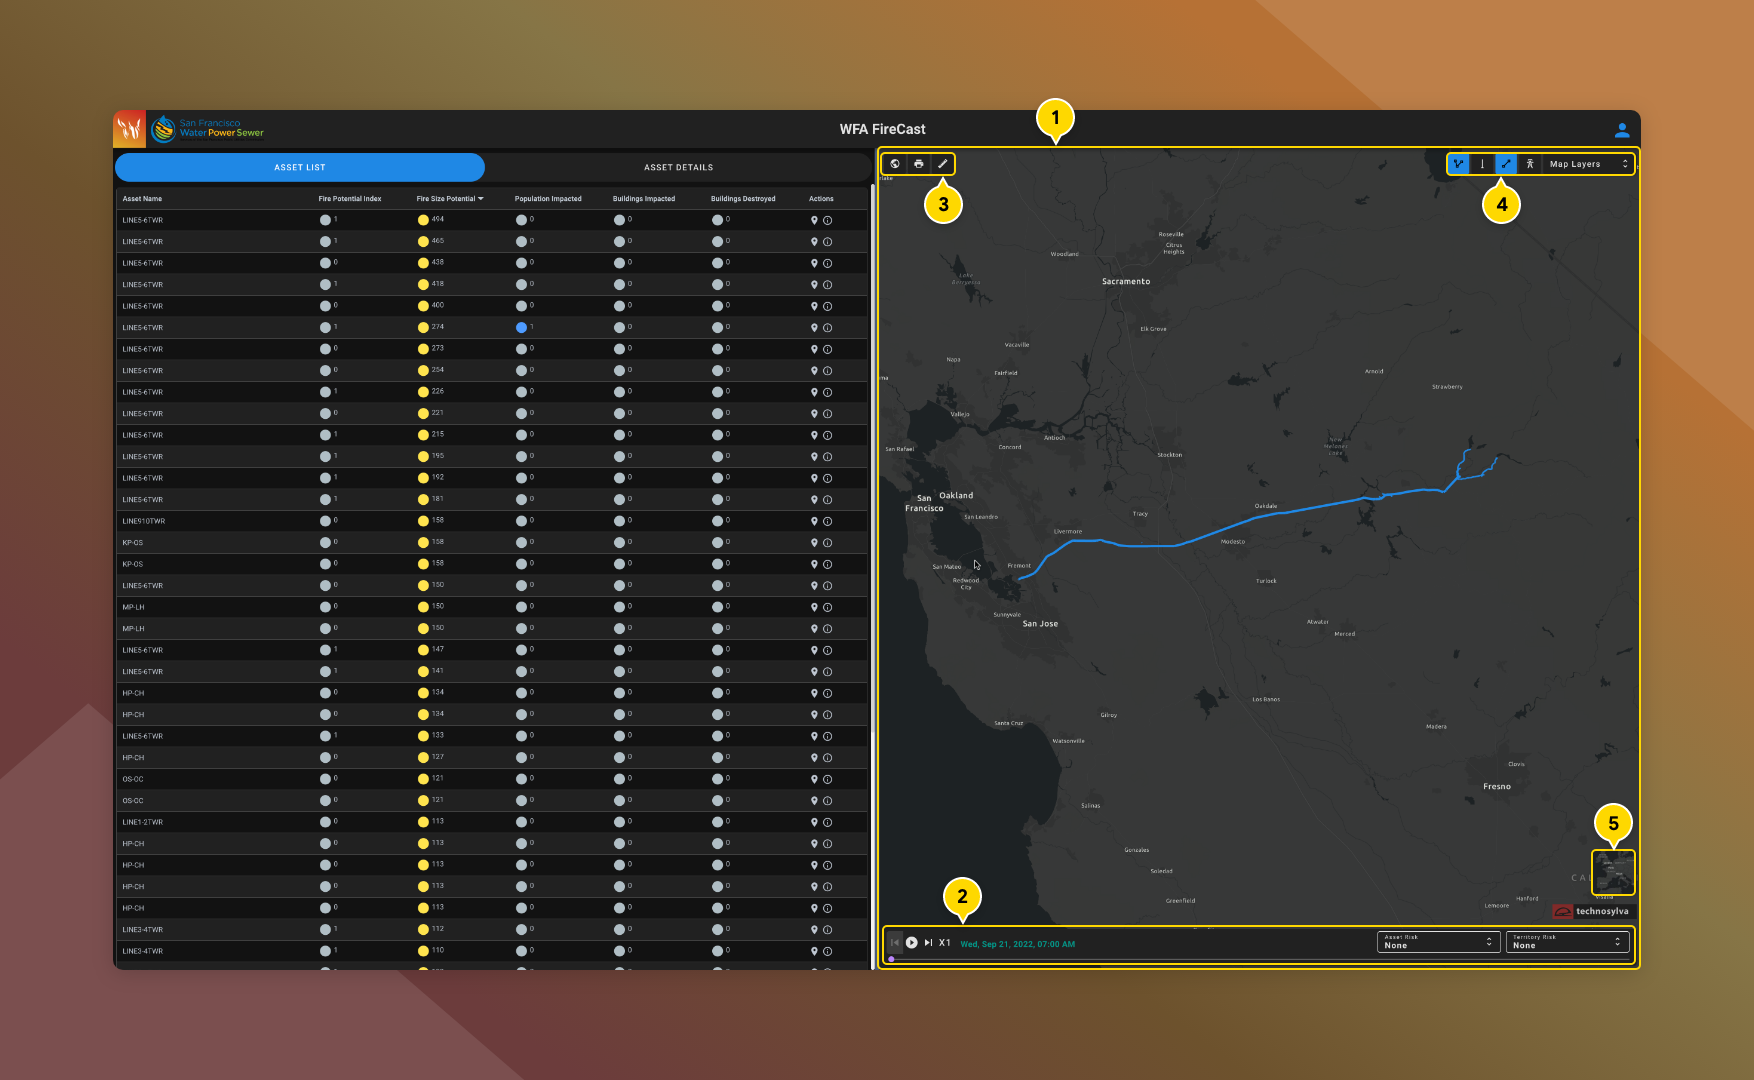
Map canvas.
Wildfire Analyst has been designed to be both map and asset centric. This means that the map canvas is always visible to some extent regardless of the tools that are being used. The application is asset centric in that it not only provides an overview of all assets for your service territory, but gives you the ability select a specific asset to work with. This allows you to only drill down on the asset that is most pertinent to you or a given scenario, providing focused situational awareness and risk metrics.
Map Canvas: The map canvas displays all of your assets on the map and gives you the ability to view both asset and territory risk metrics over the 100+ hour forecast. The map canvas also provides additional map tools and the ability to view and add reference layers such as active incidents, cameras, severe weather watches and warnings, etc.
Timeline Control: The timeline control lets you view and cycle through asset risk and territory (risk, weather and fuel moisture) forecasts. This is also where you will turn on and off the asset risk and territory risk layers to view them on the map canvas. Learn more about the timeline control and viewing risk layers.
Map Tools: Map tools such as measure, print map and zoom to full extent can be found here.
Map Layers: Reference map layers can be found here. The map layers panel contains a list of reference layers, as well as the ability to add session based layers from your computer. Layers that have been favorited will appear outside of the map layers panel for quick access. Learn more about working with map layers.
Basemap Selector: Change the basemap of the map canvas.