
LFM Stations Dashboard
Click the LFM Stations Dashboard button to open a dashboard displaying Live Fuel Moisture sampling site data.
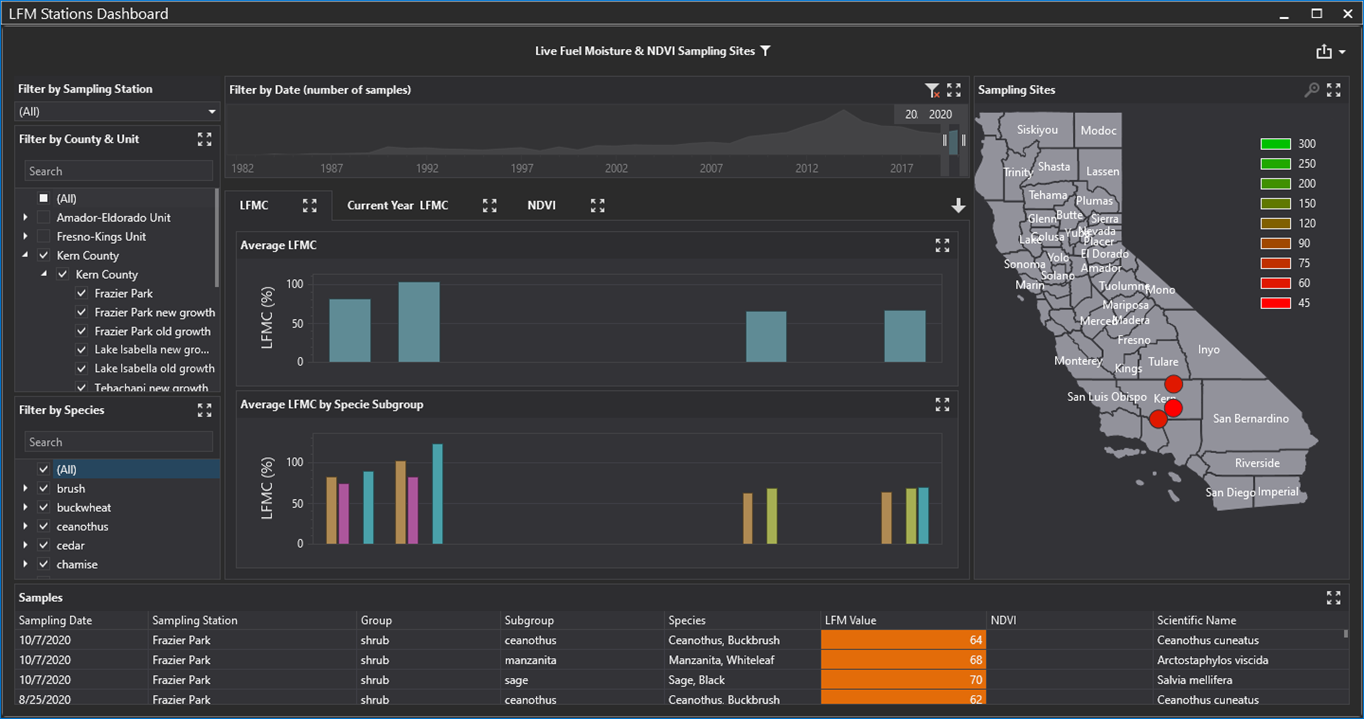
Filter information displayed by selecting Counties
Use the time slider to show data for a specific range of time
Sort data by clicking any column header
Select a species to see only data for that species
Hover over charts and graphs to see more information