
Using the FireRisk Identify Tool

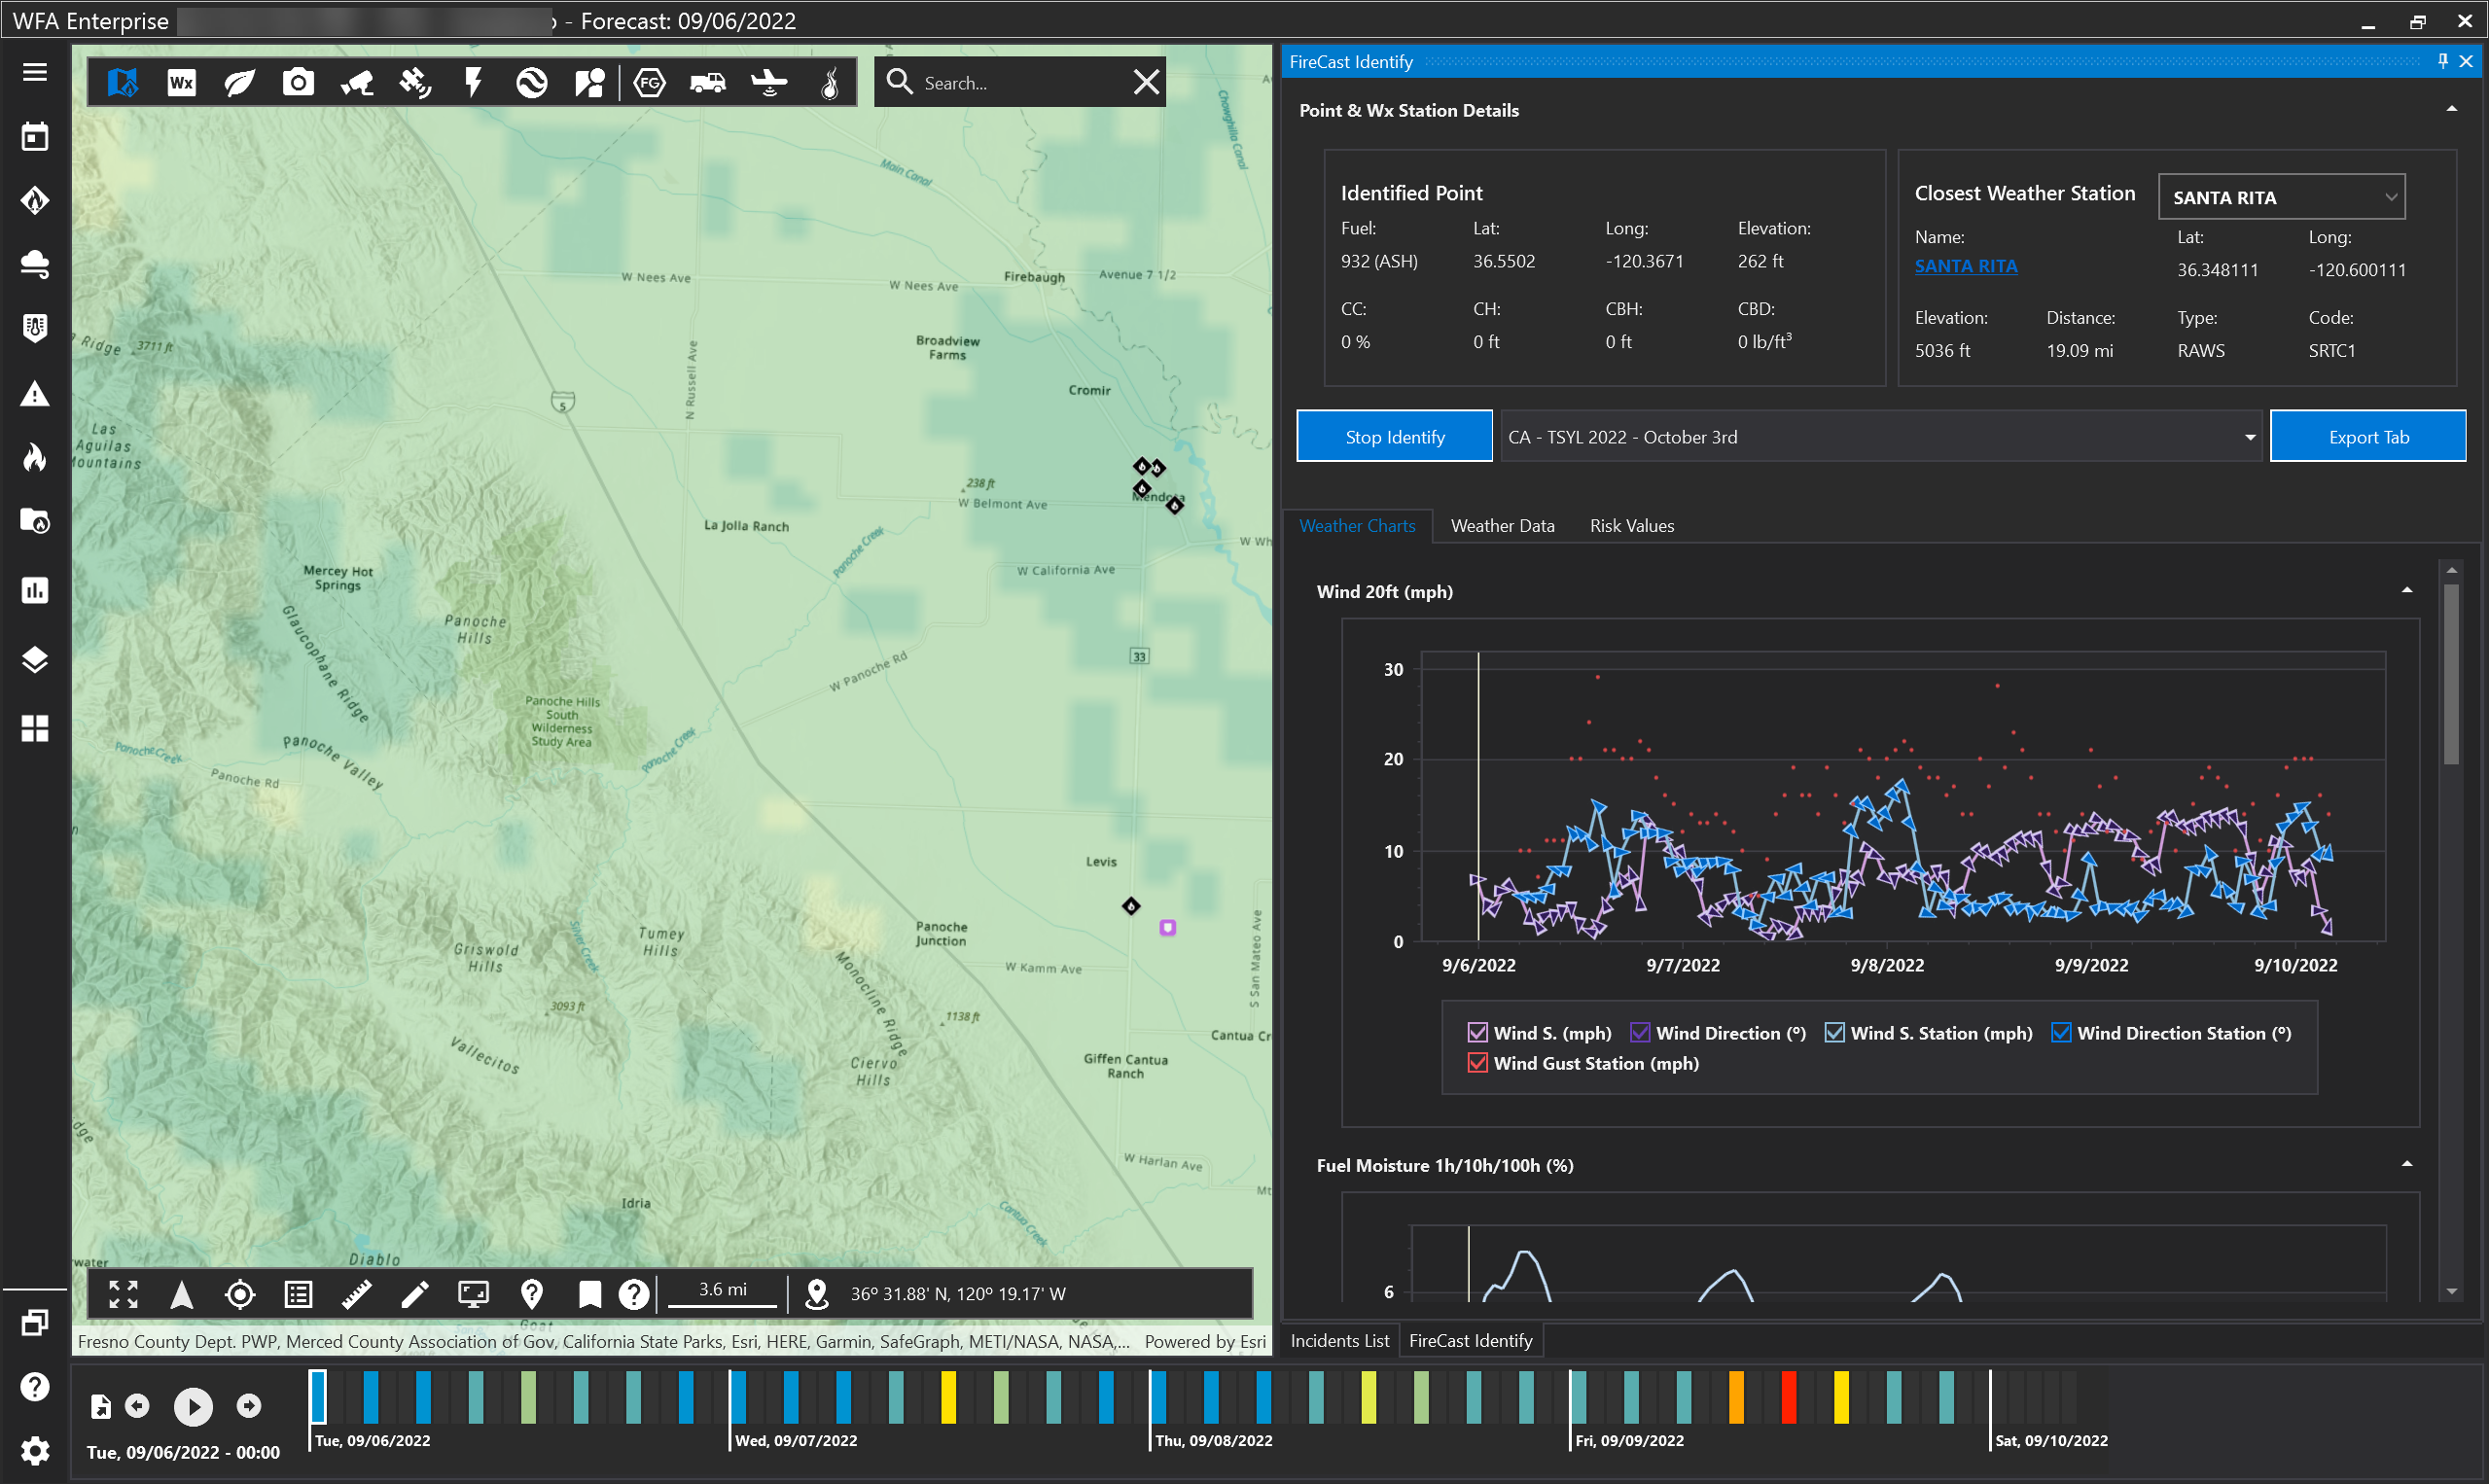
The FireRisk Identify Tool allows you to click any point on the map and see all weather, fuels, and risk information at that point for the current forecast.
Identify a Location
To identify a location:
Click the FireRisk Identify Tool to toggle open the tool window
Click the Start Identify button to activate the tool
Select a Fuel Model set from the drop menu next to Start Identify
Click on a location on the map. Your selected location will appear on the map with a purple marker.

Click the Stop Identify button to deactivate the tool.
All information for the current forecast will appear.
Point & Weather Station Details
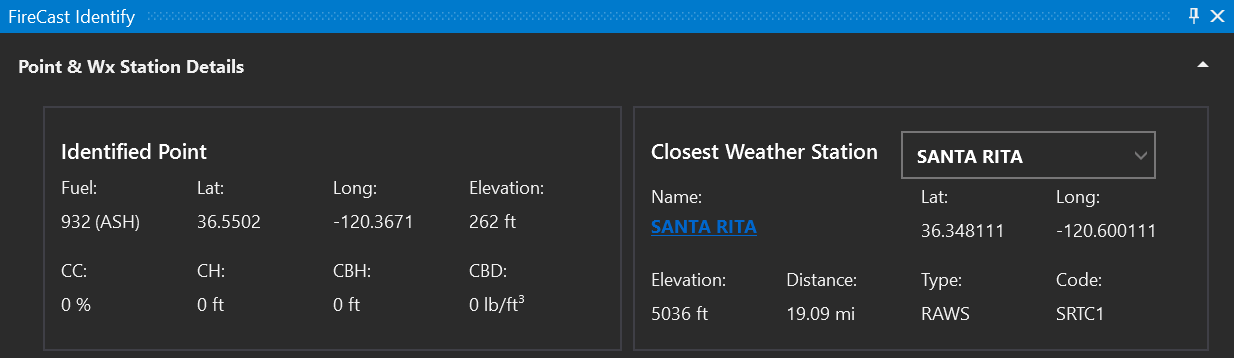
Click the arrow in the upper right corner of the panel to expand/collapse the point and weather station details. The left side of this section shows you the surface fuel and canopy information for the point on the map. It also shows the latitude, longitude, and elevation of the point. The right side of this section shows the closest weather station to the point and information about that weather station. Click the weather station link to see more details about that weather station in your browser.
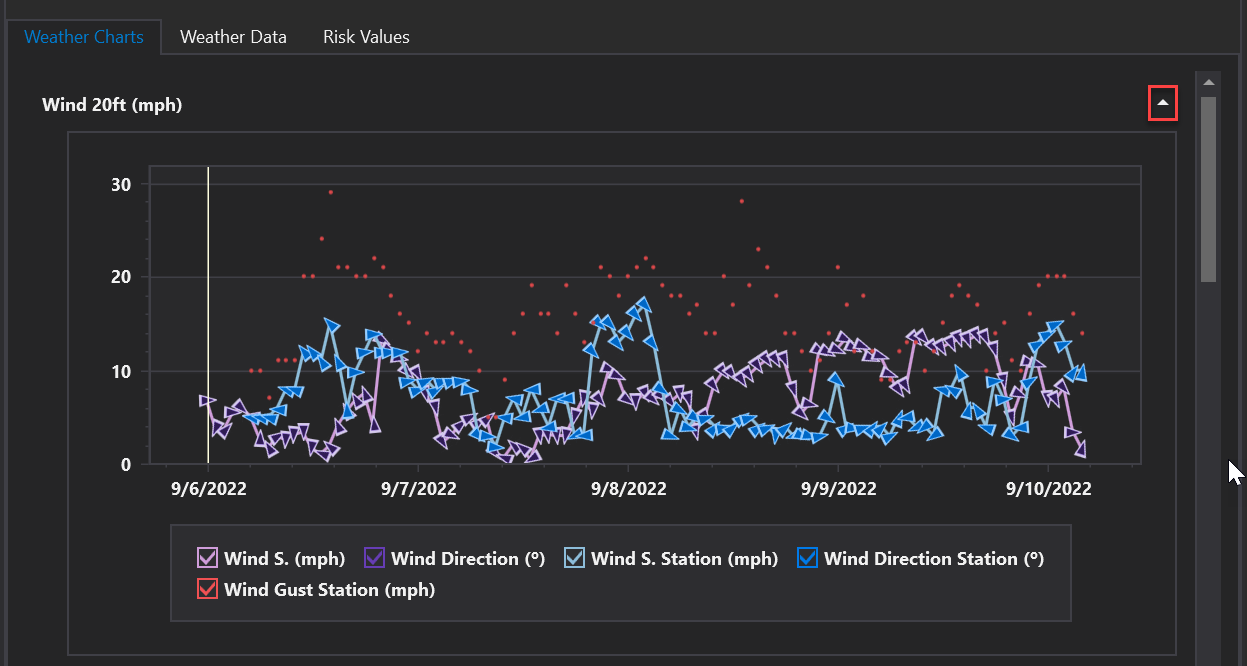
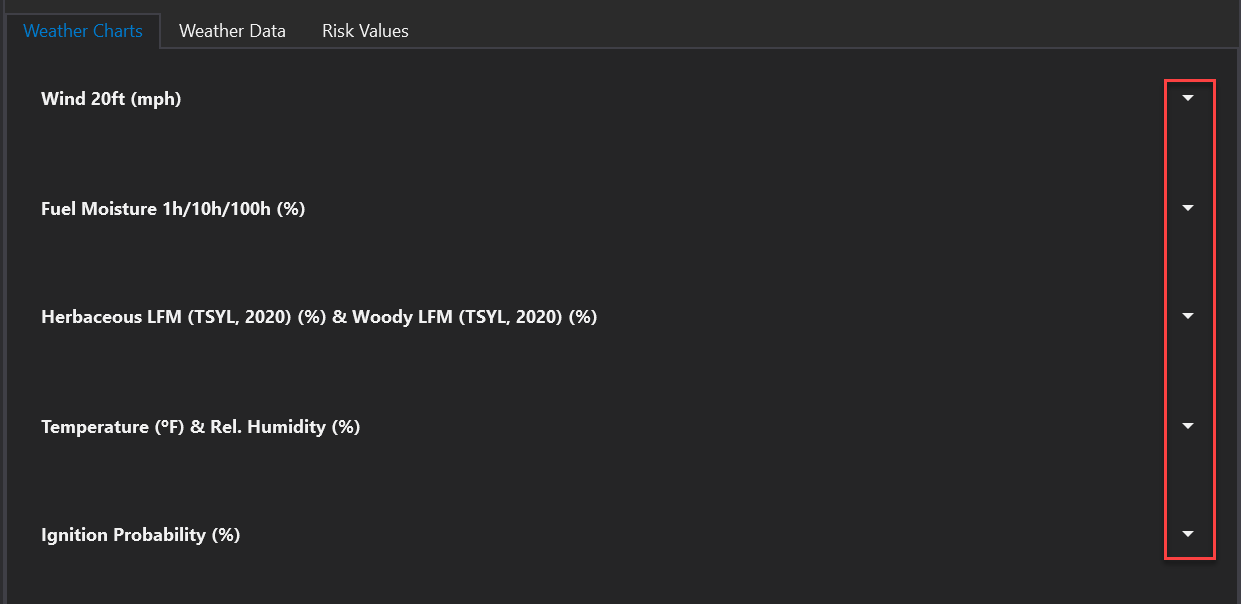
Viewing Weather Graphs
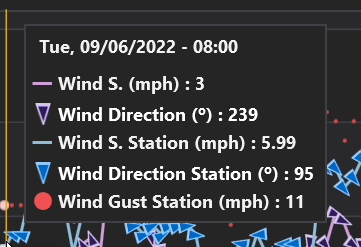
To view weather graphs select the “Weather Charts” tab. The vertical line across all graphs indicates the date/time selected on the timeline. Hover the mouse over any point on any graph to see values for that date/time.
Categories may be different in your version.
Expand a Graph
Each graph can be expanded or collapsed by using the arrows to the right of each graph section.
Weather Data Grid
Click the “Weather Data” tab to see the information in a gridded view.
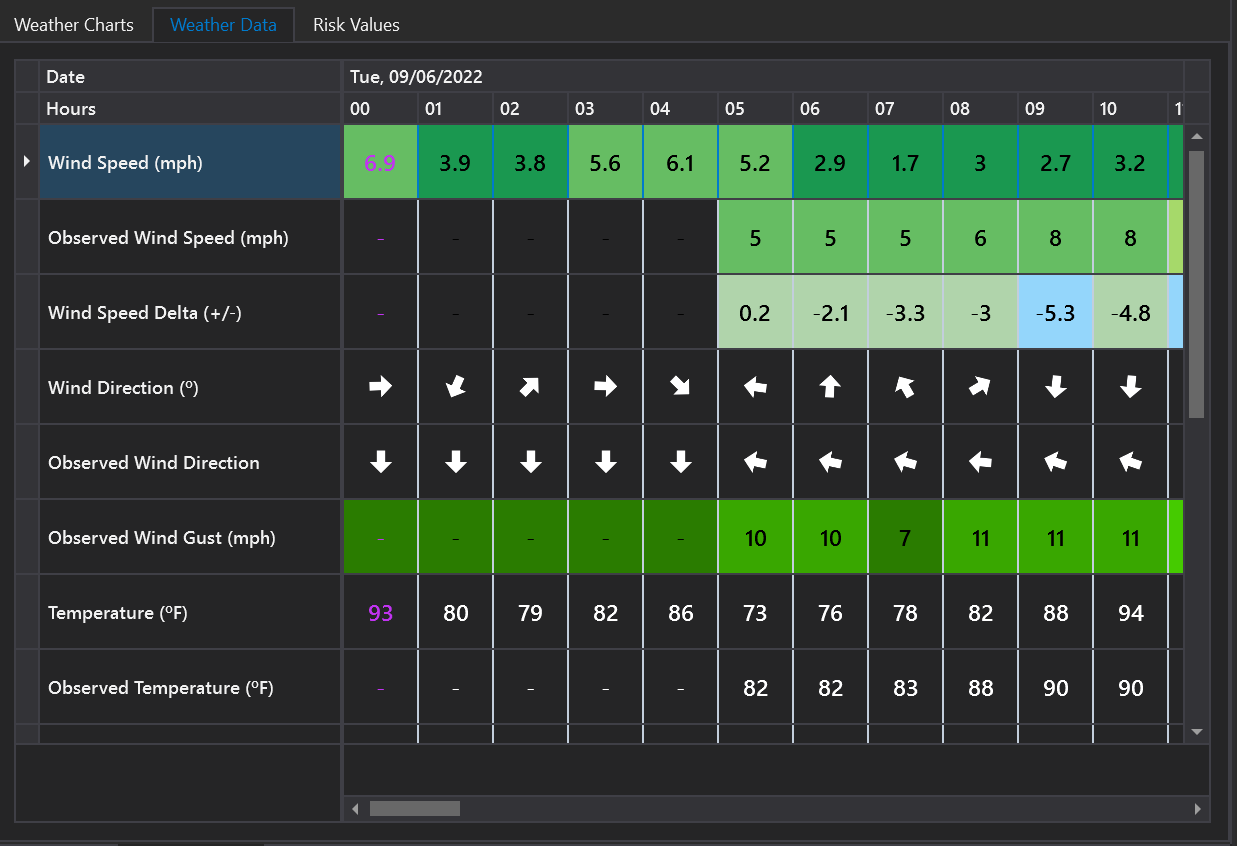
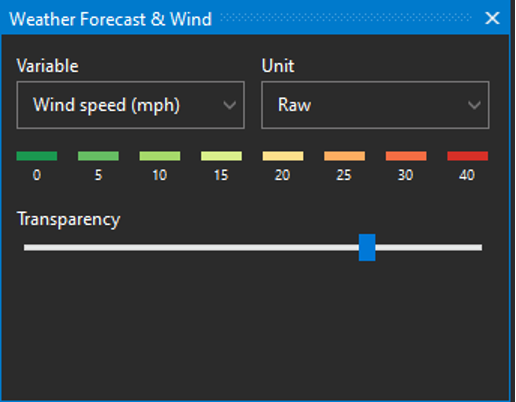
Wind Speed, Observed Wind Speed, and Observed Wind Gust are color coded to match the Wind Speed legend from the Weather Forecast & Wind tool. Observed data are from the closest weather station (see Point & Wx Station Details section at the top of the panel).
The Wind Speed Delta is the Predicted wind speed minus the Observed wind speed. This row is also color coded. Light green indicates the observed value is within range of the predicted value. Light blue indicates the model under predicted the observed values. Pink indicates the model over predicted the observed values.
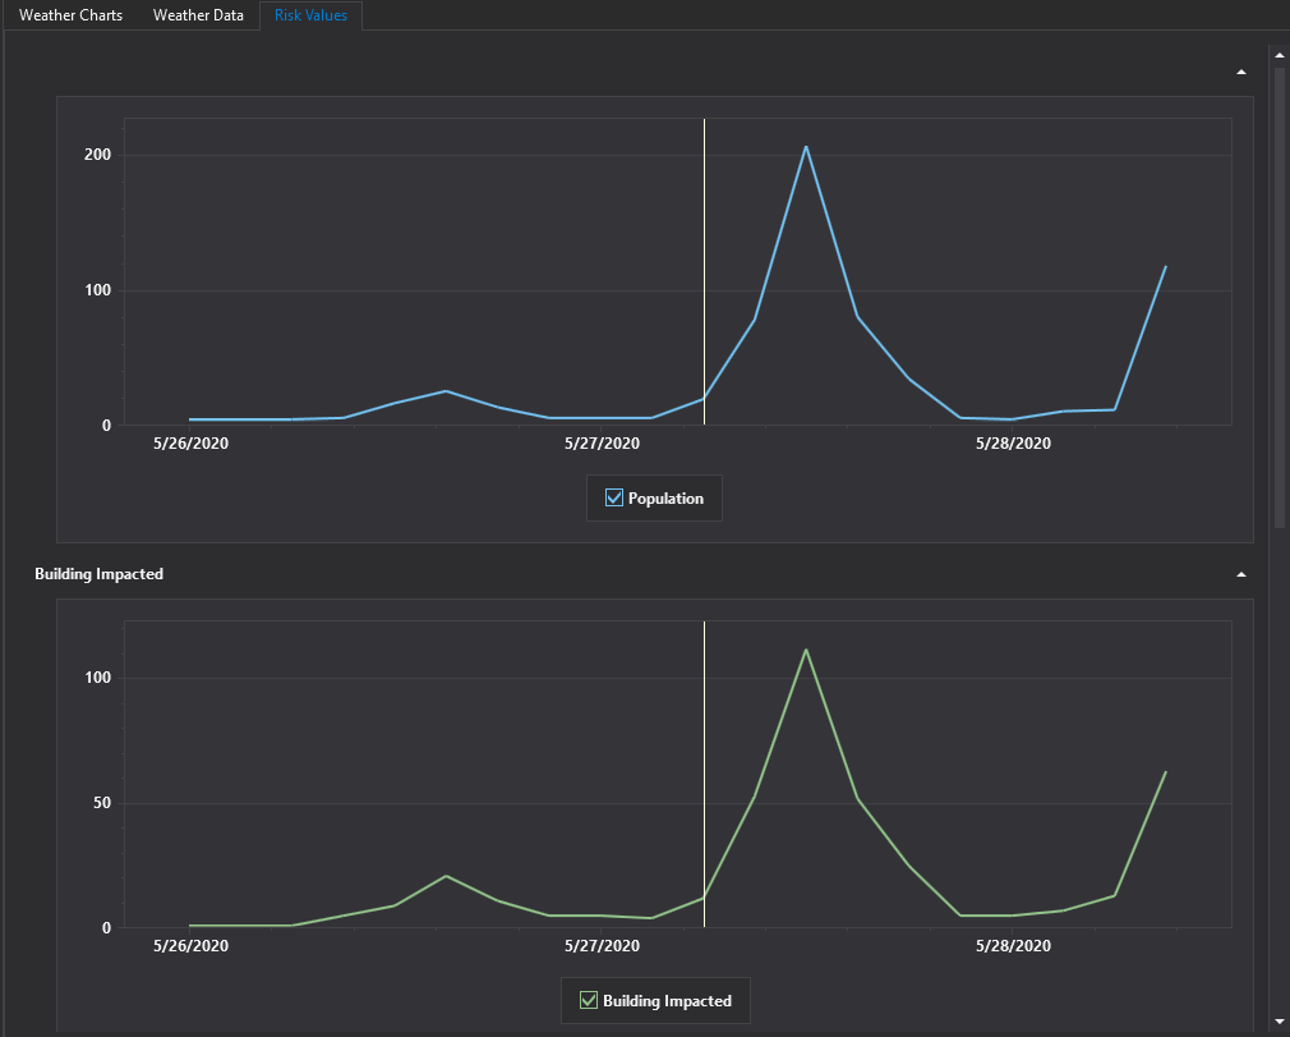
Risk Values
The “Risk Values” tab shows risk values for the selected location across the entire forecast. These may include Population Impacted, Buildings Impacted, Fire Size Potential (ac), and Fire Volume (ac x h).
Export Results
Use the Export Tab button to export information for any tab.
Chart view exports to a PDF file and Grid view exports to a Microsoft Excel file.