Viewing the Risk Forecast

Risk forecast outputs are created nightly and are available for display using the Risk Forecast tool.
You cannot create new risk outputs manually.
Select & View a Risk forecast
Select the Risk Forecast tool from the menu.
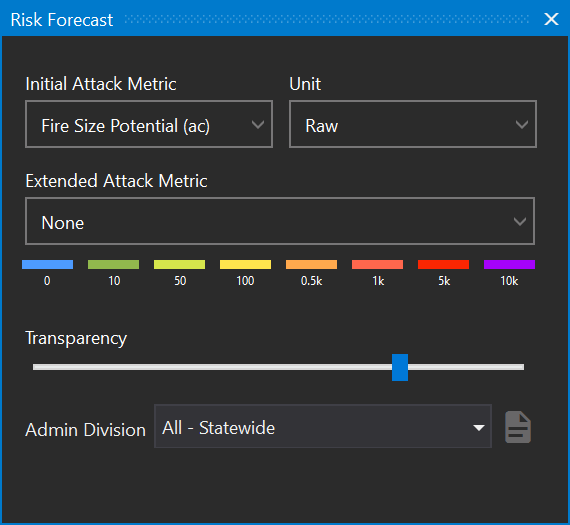
This tool allows you to select specific metrics and desired units for display. Selected metrics may also be shown by asset type, depending on your version of FireRisk.
Metrics in your version may be different than shown

Select a metric - the legend will populate for the unit selected and the risk layer will be displayed on the map.
Select a unit for the values displayed. Layers can be displayed as Raw values or Percentiles. Raw values are selected by default. The map will refresh based on the unit selected.
Use the transparency slider to adjust transparency if needed
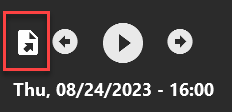
Use the timeline controls to see changes across the forecast
Select a bar on the timeline to view the risk output for that time
Use the right arrow button to incrementally view times. Note that risk will not change for the hours in between the 3 hour interval for risk outputs
Press the animate arrow to animate the risk output
Ensure you have selected a colored bar on the timeline to view risk results. Selecting an hour where there is no risk output may result in the map disappearing until you select an hour with risk (colored bar).
The output maps represent the potential impacts associated with each ignition location either around an asset or across the territory. Areas with high risk (red) reflect ignition locations that may have significant impacts should a fire start at that location. Risk metrics are based on an 8 hour simulation started at the specific time period selected using the hourly forecasted weather conditions.
Export Territory Risk
Use the export button on the timeline controls to export the territory risk forecast to a KMZ file or GeoTIFF.

