Impact Summary
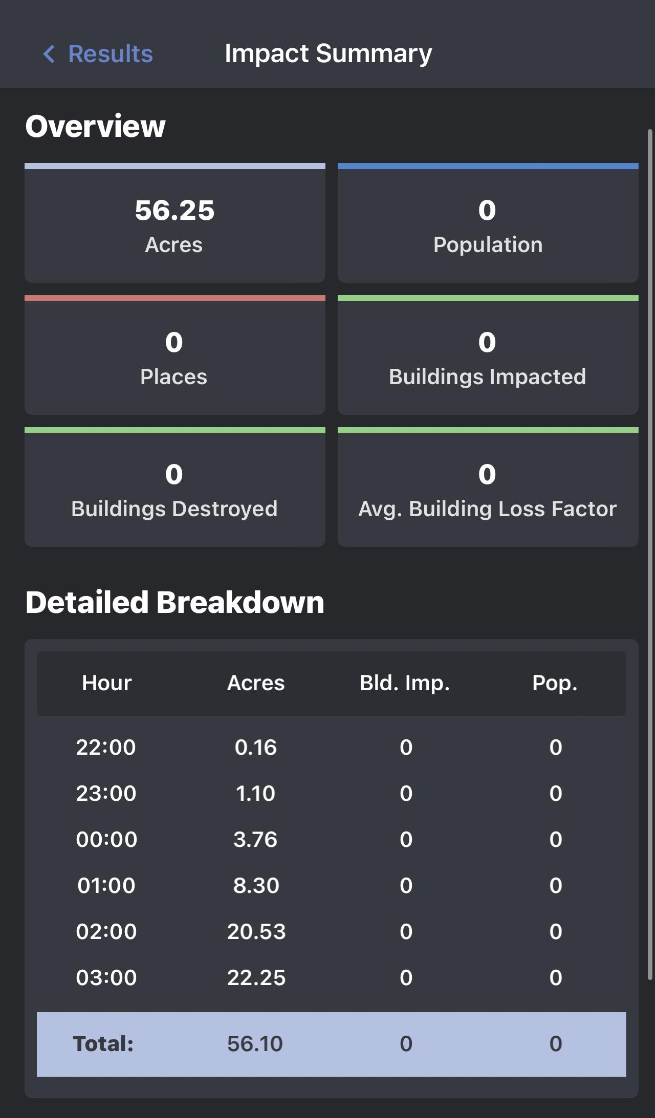
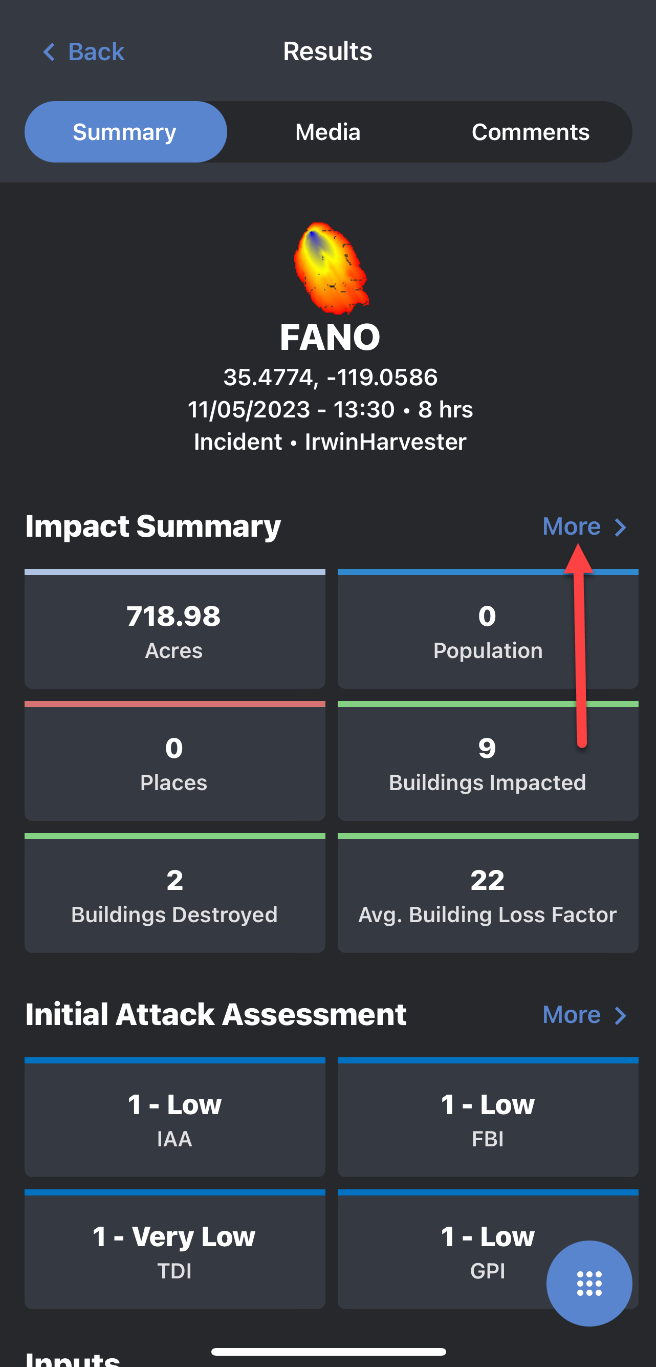
The impact summary section provides a more detailed breakdown of the simulation’s impacts including acres, buildings, and population on an hourly basis. A high-level overview of the impact summary can be viewed in the summary tab of the results panel. Tap on more to view more details of the impact summary.
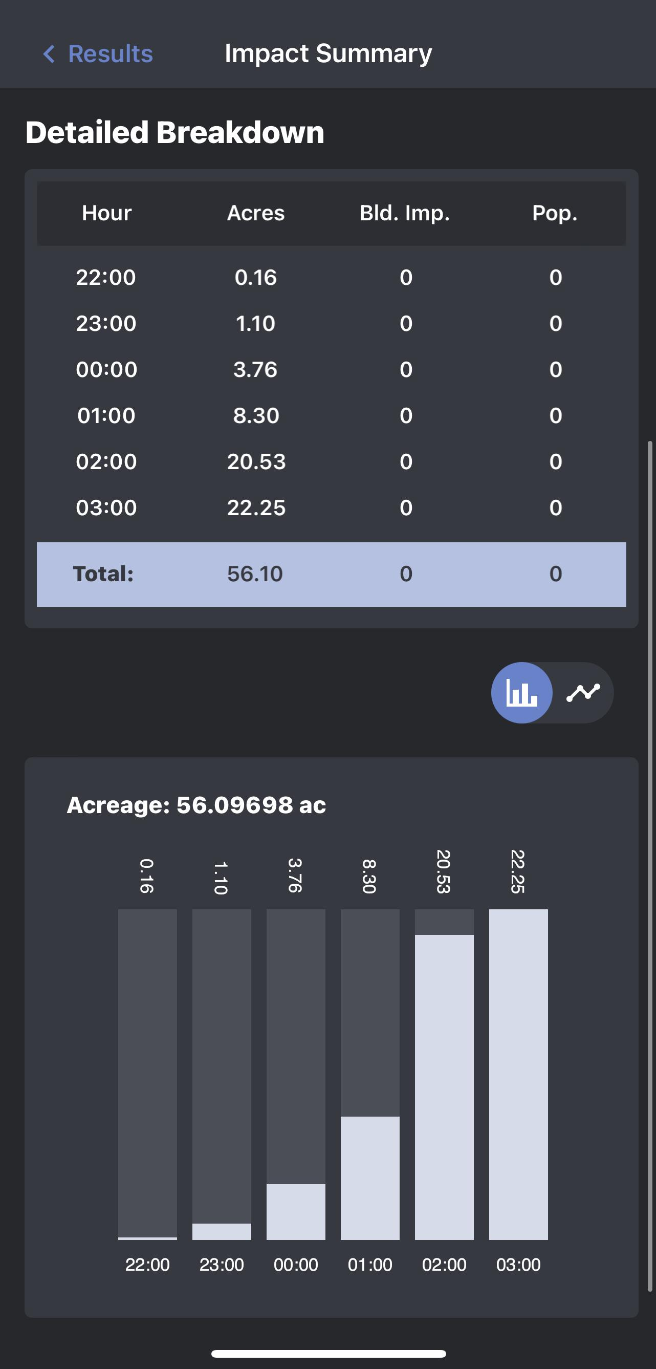
The impact summary can be viewed in both table and graph forms. The table provides you with details about acreage, number of buildings, and population for each hour of the simulation at the same time, while the graphs allow you to focus on one specific category at a time. The graphs also provide a visual representation of the impacts to allow you to easily determine the most severe times of the simulation.