
Data Outputs
In FireRisk, prediction impacts are computed based on the final perimeter of the 8-hr unsuppressed fire simulation.
The following impacts are calculated:
Note: The "expected" terminology originates from the statistical expectation which is the probability of an event multiplied by its consequence. All the expected risk metrics are calculated with this methodology of POF * consequence.
Fire Size Potential - Total simulation size in acres. The Fire Size Potential represents the actual simulated acreage of a fire based on the local fuels, weather, and terrain starting from an ignition at a specific location and time.
Population Impacted - Total population impacted by the simulation footprint.
Buildings Threatened - Total number of buildings threatened by the simulation footprint.
Estimated Buildings Destroyed - Estimated number of buildings destroyed for each simulation, derived using Building Loss Factor (BLF) data assigned to each building.
Initial Attack Assessment - Provides an estimation of the difficulty of fire control in the first 1-2 hours after ignition time, ranging from 1 to 5. The higher the value, the more likely the fire is to escape the initial response ending in a potential threat.
Fire Potential Index - The Fire Potential Index (FPI) quantitatively estimates the fire activity potential territory-wide and leverages hourly 1km weather data and a remote-sensed daily fire occurrence dataset (from 2012 to present) to train a machine learning model to predict potential fire activity across the landscape. This model quantifies non-linearities between, weather, fuel and topography, and fire growth. We analyzed the FPI performance through verification of results with more than 10+ years of FPI data and a team of experts in fire science daily conduct validation of the index with past major fires. These categories represent the percentile of the FPI index within the domain (see example in the following table):
Some customers have incorporated their proprietary FPI for use in their Technosylva products.
Fire Behavior Index - The Fire Behavior Index (FBI) is computed using the average Flame Length and Rate of Spread on the fire front during the whole duration of the fire (the 8-hr unsuppressed fire simulation). It is calculated based on the Rate of Spread of the fire in chains per hour (80 ch/hr = 1 mi/hr), and Flame Length in ft. These values have a direct relation to suppression activities, as the commonly used Hauling Chart summarizes. Essentially it details how large and fast-moving the flames are over the burn duration.
The different values of FBI vary from 1 (Low) to 5 (Extreme) as shown in the next table.
FBI Class | Description | |
1 | LOW | Fire will burn and will spread however it presents very little resistance to control and direct attack with firefighters is possible |
2 | MODERATE | Fire spreads rapidly presenting moderate resistance to control but can be countered with direct attack by firefighters |
3 | ACTIVE | Fire spreads very rapidly presenting substantial resistance to control. Direct attack with firefighters must be supplemented with equipment and/or air support. |
4 | VERY ACTIVE | Fire spreads very rapidly presenting extreme resistance to control. Indirect attack may be effective. Safety of firefighters in the area becomes a concern |
5 | EXTREME | Fire spreads very rapidly presenting extreme resistance to control. Any form of attack will probably not be effective. Safety of firefighters in the area is of critical concern. |
Probability of Fault/Failure - The daily probability of fault (POF) represents the probability of having at least one sustained fault/outage on a circuit within a 24-hour period, and displayed as the daily aggregated value. This probability is calculated from a statistical model that is trained on historical weather data, historical outages, and asset information. The purpose of this layer is to highlight the circuits that have an elevated outage probability during a wind event.
Response Complexity - Consequence metric for individual fire spread predictions that evaluates the complexity of fire response during the first 2 hours after ignition. It combines different factors: terrain difficulty, fire behavior, initial growth behavior, number of buildings impacted, number of firefighting resources, and number of active fires (simultaneity).
Rate of Spread (ch/h) - The speed with which the fire is moving away from the site of origin. Calculated as an average value at the front of the fire.
Flame Length (ft) - The distance measured from the average flame tip to the middle of the flaming zone at the base of the fire. Calculated as an average value at the front of the fire.
Wind Speed - Forecasted maximum hourly wind speed across the circuit.
Wind Gust - Forecasted maximum hourly wind gust across the circuit.
Relative humidity: Forecasted hourly snapshots of the relative humidity two meters above ground level. Relative humidity is a measure of how much water vapor is in the air compared to the maximum amount possible.
Raw vs Percentiles
Raw: Raw values represent the deterministic fire consequence metrics for a given date and time.
Forecast Percentiles: The forecast percentiles is the percentile of fire consequence metrics considering the forecast duration.
Historical Percentiles: The historical percentiles are calculated by comparing the fire consequence metrics for a given date and time with the historical data stored in the WFA databases.
Fire Potential Index (FPI)
The FPI system consists of three interconnected metrics that work together to provide a comprehensive assessment of fire potential:
FPI Raw (FPIR) serves as the foundational metric, predicting fire activity and rate of spread through the integration of the environmental variables described above. FPIR values represent absolute environmental conditions conducive to high fire activity and rapid fire spread, enabling direct comparisons across different regions and time periods.
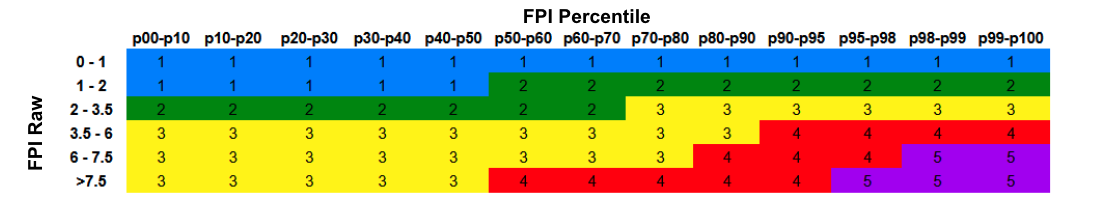
FPI Percentile (FPIP) contextualizes the current FPIR value within the historical record for each specific location. By characterizing the probability of a given FPIR value occurring, FPIP captures local environmental variability and identifies conditions that are extreme relative to local norms. This percentile approach ensures that the index remains sensitive to regional climatological differences while identifying locally anomalous conditions.
FPI Composite (FPIC) represents the primary operational metric, combining both absolute fire danger conditions (FPIR) and local context (FPIP) into a discrete rating scale from 1 to 5. As shown in the FPIC classification matrix below, this composite index is derived by matching both FPIR and FPIP bin ranges, with the design specifically focused on identifying the intersection of high danger conditions and low-frequency events that lead to extreme fire potential. The breakpoints for these categories were empirically derived from the analysis of historical fire data to ensure each level corresponds to meaningfully different fire behavior characteristics.
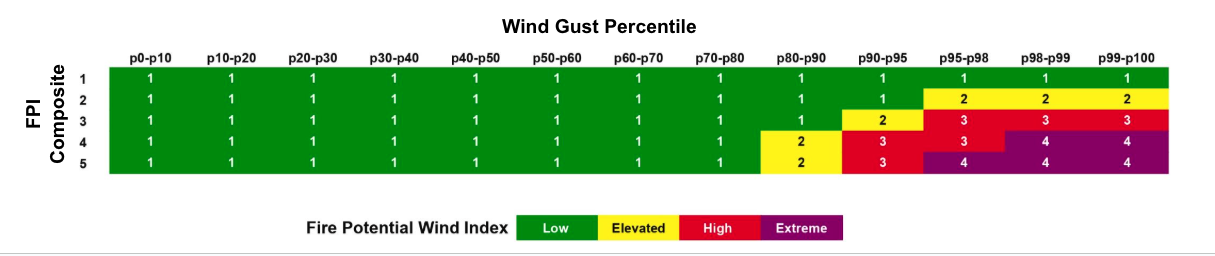
Fire Potential Wind Index (FPWI) - The Fire Potential Wind Index (FPWI) extends the FPI framework to specifically address utility operational needs, particularly for Public Safety Power Shutoff (PSPS) decision-making. FPWI captures extreme wildfire conditions by combining FPI Composite levels with wind speed percentiles, recognizing that wind is a critical driver of both powerline-related ignitions and rapid fire spread.
As illustrated in the FPWI classification matrix (Figure below), FPWI values range from 1 to 4 and are determined by the intersection of FPIC levels (1-5) and wind percentiles (0-100). The index design acknowledges that powerline fires often occur during the convergence of elevated fire danger conditions and extreme wind events. For instance, FPWI level 4 conditions only occur when FPIC levels are very high (4) or extreme (5) combined with wind speeds above the 95th percentile, representing the most dangerous conditions for utility infrastructure.
Note: not all risk metrics will be available in your version.